The post-election bounce in the stock market was a strong one yesterday. However, the “set up” this time around is much, much different than it has been any other time over the past 30 years (or more). Thus, the normal post-midterm election advance is not a sure thing.
The most important issue in this “set up”…is that the stock market is significantly more expensive than it has ever been coming out of a post-election timeframe.
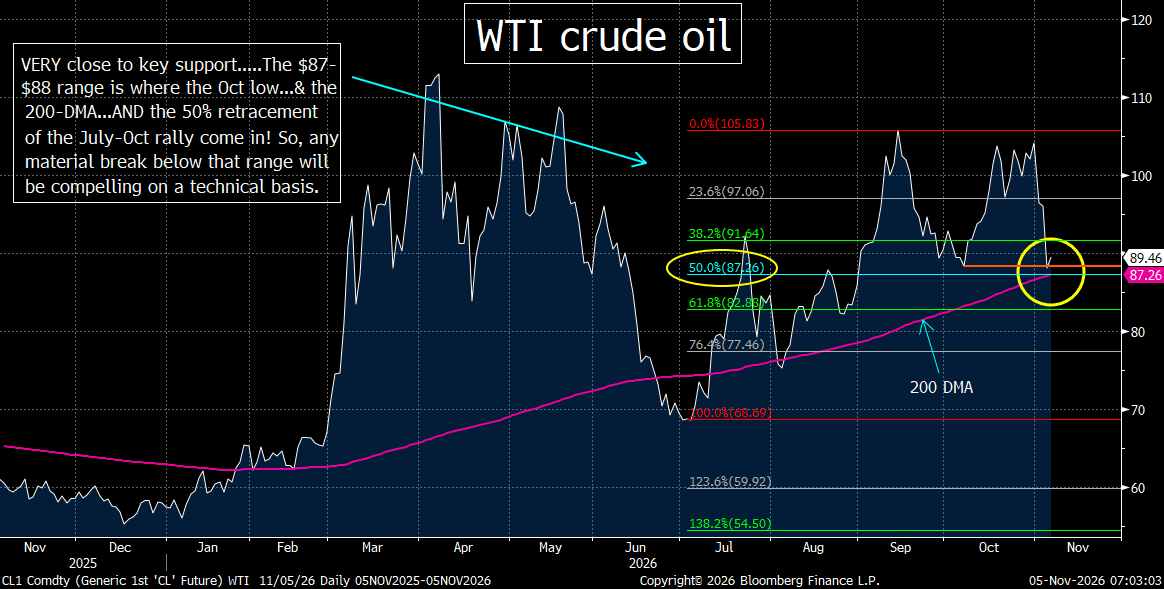
Crude oil’s recent sharp decline has it testing an important support level.
The rally in the stock market yesterday was a good one…and it could be something that continues through the Anthropic IPO…or even though the end of the year. The advance came on a large increase in volume…and nine out of the eleven S&P 500 sectors closed in positive territory. The advancers vs. decliners were less impressive, however. It was less than 3 to 1 positive for the S&P 500…and less than 2 to 1 positive for the NDX 100. Thus, the breadth of the rally was not overly exciting…but given how narrow the moves for the equity market have been in both directions this year, this was not a big surprise.
The was no question that a lot of “rotation” was going on yesterday…most of it WITHIN the tech sector…as the chip stocks declined, and the hyperscalers advanced (very strongly). This is something we have seen many times over the past six months or more. However, this time this kind of action also included a strong rally in several other groups. Therefore, the major averages finished the day with very nice gains.
This action has led some investors to assume that we’ll see the kind of seasonally positive action we usually see in a midterm election year…between Election Day and the end of the year. Most of the time, the stock market rallies does indeed rally into the end of the year…but we have to point out that the last time President Trump faced a midterm election, the stock market rallied 2% the day after the election, BUT it then proceeded to rollover and decline more than 16% over the next 7-8 weeks! In other words, the positive year-end “seasonality” issue for midterm years is far from a perfect one.
We’d also note that the “set up” for this year’s post-election performance is much different than it usually is…and thus, it’s going to be harder to see that “usual” advance. In fact, it’s also going to be tougher for the market to be higher 12 months from now…like it usually is after a midterm election…..Again, the “set up” is much different this time around.
When it comes to the Presidential Election Cycle, the second year (the midterm year) is consistently the worst one of the cycle. The average rally is about 6%...and the market is generally up by about 4% on Election Day. This year, however, the stock market is up by 12%...so it’s not spring-loaded like it usually is coming out of a midterm election.
More importantly, it is MUCH more expensive that it usually is at this time in the cycle. As we highlighted in our panel discussion on CNBC this morning, over the past 30 years, the average price-to-sales ratio has been 1.7x…with only one of them more than 2x (and it was barely more than 2x). In fact, if you go back further, the average P/S reading is even lower…….However, right now, that ratio is 3.5x…more than TWICE the average! So, as you can see, the stock market is A LOT more expensive today…than it has been at any time in the past when we’ve moved past the midterm election timeframe…..With THIS kind of “set-up,” it’s going to be a lot tougher for the stock market to push higher in the months ahead.
One of the key reasons for the rally yesterday was the outsized decline in crude oil prices. The further drop in Brent took it below the $100 level…and the WTI decline took it below $90. The initial decline came from the idea that the Democratic sweep in Congress would be something that might help defund the war…and ease the global supply constraints. The decline accelerated after Vice President Vance made blamed the electoral loss on the war…which led some people to think that the Administration (and the GOP) is growing tired of the conflict.
This morning, oil is experiencing a mild rebound…but most of the sharp decline which has taken place so far this month is still in place. WTI is still down almost 15%...and it is now very close to a key support level. Looking at the chart below, you can see that WTI is testing its low from October of about $88. It is also just above the $87 level…which is where both the 50% retracement of the July-October rally, AND the 200-DMA come in. Therefore, the $87-$88 range is a very important support range for WTI crude oil.
Of course, as we highlighted last week, any new-news on the geopolitical front is going to be much more important than these technicals of crude oil right now. However, since commodity traders invented technical analysis, it’s still important to highlight these issues.
For us, we remain extremely skeptical about the idea that the conflict in Iran is going to get resolved in a significant way soon. Thus, we believe that this recent decline has more to do with repricing the risk of immediate escalation…than something that will lead to a quick resolution and a further decline in price of substance. Therefore, absent any major new development, we do believe that the $88-$89 range could/should help support the commodity over the near-term.