
Just because a Situation is Not a Systemic Threat…Does not Mean it Won’t Create Significant Problems.
Table of Contents:
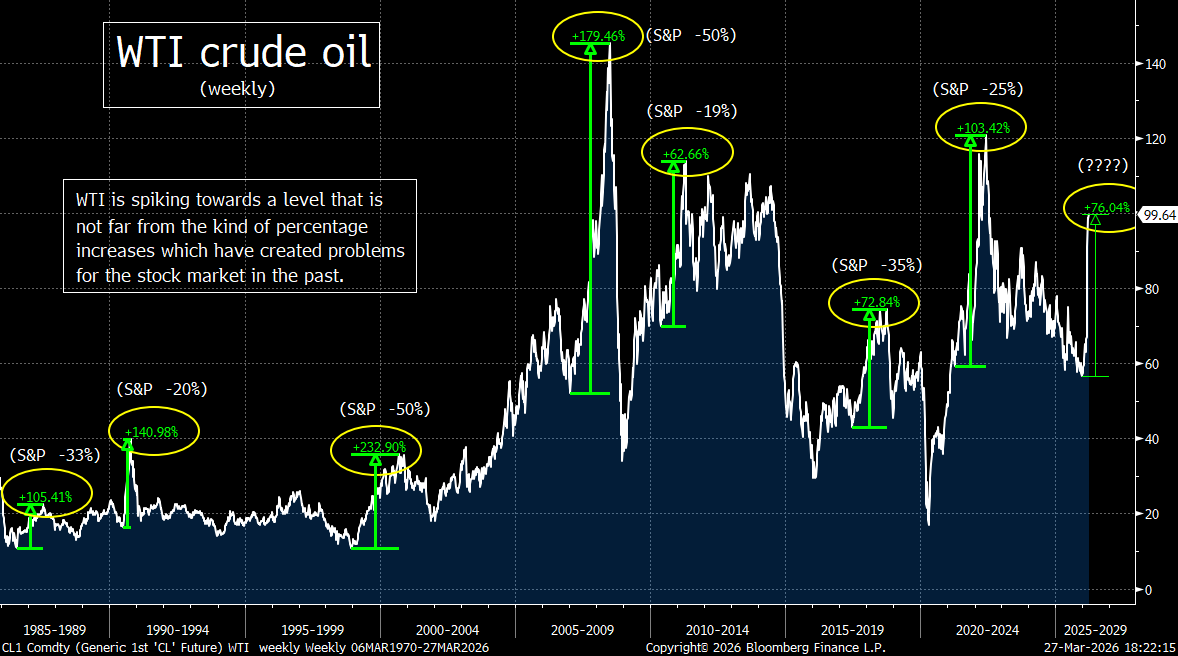
1) When oil spikes last for more than a few weeks…and rise 80%...it always has a negative impact on the stock market.
2) Private Credit: “It’s not just a crisis of confidence; it’s a crisis of really bad underwriting.”
3) The tech sector is getting hit by both negative fundamental news and negative technical development.
4) There are still plenty of reasons to thing the stock market can rebound quickly…and strongly.
5) Charts on the major averages: Some real technical damage has been done.
6) The Treasury market is also seeing some broad technical damage as well.
7) Are some of the key assets finally regaining their “safe haven” status?
8) Keep a close eye on the European bank stocks.
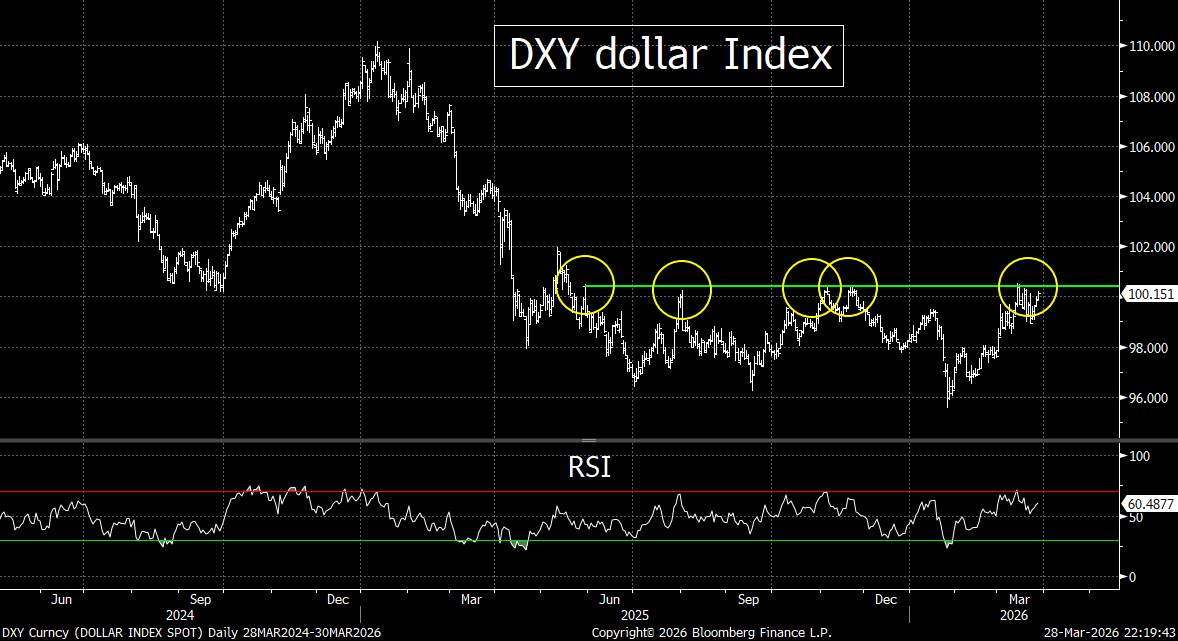
9) Potpourri….US dollar testing key restistance.
10) Summary of our current stance.
---1) If you look at history, it tells us that if the price of oil stays as high as it is now…for just a short while longer…the stock market is not even half way through its decline yet……President Trump will not be able to change the narrative with a flip of a switch…like he did last year on the tariff issue. Therefore, unless the next surge in the attacks by the US and Israel are incredibly decisive, the line of least resistance for stocks is still lower.
Needless to say, the ongoing war involving Iran continues to exert a significant and evolving impact on U.S. financial markets…primarily through surging energy prices, rising long-term interest rates, and growing risks to economic growth. At the center of these disruptions is the continued restriction of tanker traffic through the Strait of Hormuz, a critical global energy chokepoint.
Crude oil prices have risen sharply since the conflict began…with WTI crude rising 80% from its December lows (+52% since the war began)….and Brent crude oil up almost 90% YTD (+60% since the war started almost one month ago). Of course, this surge reflects the effective closure of the Strait of Hormuz…which (as we all know by now) typically handles roughly 20% of global oil and liquefied natural gas flows. With tanker traffic severely constrained…reportedly as much as 95% halted at times…the global supply shock has pushed energy markets into extreme volatility and elevated price expectations.
The spike in oil prices has directly contributed to rising inflation expectations…which in turn has driven a notable increase in long-term U.S. interest rates. Treasury yields have moved higher as markets shift from anticipating Federal Reserve rate cuts to pricing in the possibility of further tightening. This rise in yields has already begun to ripple through the economy, pushing mortgage rates higher and tightening financial conditions more broadly.
The action in the stock market at the end of last week was quite telling. The fact that the market did not respond positively to the President’s most recent change in the deadline for Iran…shows that this is a MUCH different situation than we experienced with the tariffs last year.
Back then, the decisions made by President Trump were the only things that mattered. He could flip a switch at will…..Today, the President does not control this situation to anywhere near the same degree. Also, the change in the deadline is only impacting when the US and Israel might attack Iran’s energy facilities. It does not involve a ceasefire…..More importantly, his decisions about these deadlines have absolutely no impact on the flow of shipping through the Strait of Hormuz…..Therefore, merely “making progress” in the negotiations is not enough to impact the markets for very long…and they may not impact on the eventual outcome either…or the timing there of.
The number one issue in all this is the price of oil (duh). How high will it go…and how long will it remain significantly elevated (like it is today) is what really matters to investors. With the Houthis entering the war…by launching ballistic missiles at Israel…this spreads the war to a new front. This not only raises the odds that the war will last longer, but it could/should also impact the price of oil…given that the Houthis have the ability to attack tankers in the Red Sea…which would pinch the supply of global oil even further.
Having said this, there are also some good arguments to be made that this war will not last much longer…and thus the flow of oil will resume…and the situation will start to improve sooner rather than later. However, it is our opinion that it won’t take much longer for it to create some real problems for the economy…and for the stock market. Put another way, if the flow of oil is not opened up rather quickly…and thus the price of crude oil does not fall quickly…history tells us that the stock market is not even halfway through its decline.
First, even if the Strait were to re-open within two weeks…the expectation is that it will still only be at 80% of pre-war levels at first. Obviously, if the war lasts longer, ultimate high for both WTI and Brent will be much higher…and the return to normalcy will take quite a bit longer. The longer it takes to reopen the Strait, the longer oil prices stay extremely high…and the bigger the impact it has on the global economy.
Moving to the stock market itself, there is a misconception on Wall Street about what history tells us about “oil shocks.” If you look at history…when it comes to the idea of how much this “oil shock” will impact the markets…it’s much different than many seem to realize. We keep hearing that as long as this particular oil shock can reverse in the next month or so, the situation will revert back to the way it was in February…and the stock market will bounce-back in a major way. Well, that makes sense if the “oil shock” involves a rise of 40% or 50%...and only lasts for a couple of weeks. In those cases, the market HAS been able to bounce back quickly and strongly.
HOWEVER, when the oil spike lasts for more than just a couple of weeks…and every time in the past 50 years that an oil spike has pushed the price of oil higher by as much as it has this time around (+80%)…the stock market has always fallen by 18%-20% (and by much more than that on a few occasions). (Chart below.) No, it has not always created a recession, but it has ALWAYS caused enough turmoil to knock the stock market down by quite a bit more than it has so far this time around.
Let’s face it, you don’t have to be a market historian to know that the stock market sees an 8% decline (like it has so far) pretty much EVERY year. In other words, the stock market tends to see an 8% decline when issues that are much less serious than the ones we’re facing today (much less how much worse they might get). So, to assume that the market is starting to get quite close to a bottom is likely a mistake…especially since the market is still very expensive…at 20x forward earnings (which IS still very expensive).
Yes, the war could come to a very quick close…and the Strait of Hormuz might begin to reopen significantly very soon. Thus, we are certainly not saying that there no way that the stock market will bottom soon. What we ARE saying, however, is that the reopening of the Strait seems to be pushing out further into time after the developments of the past few days (including this weekend)…and therefore, the odds that today’s stock market pullback becomes a deep correction before it ends…are rising very quickly.
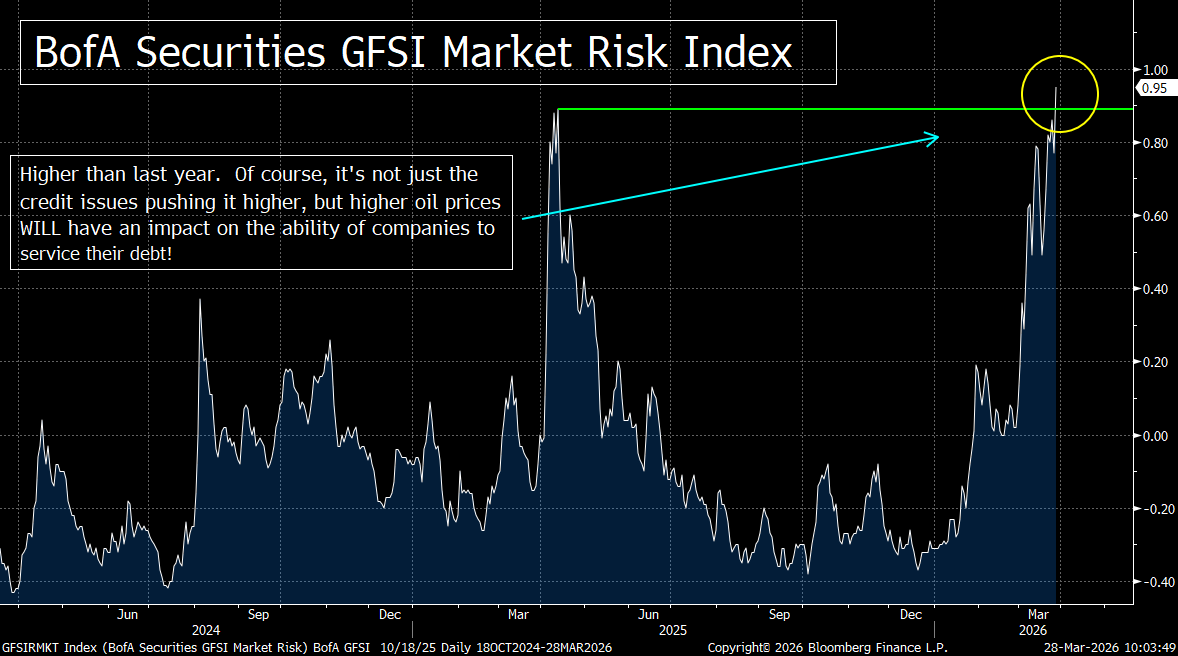
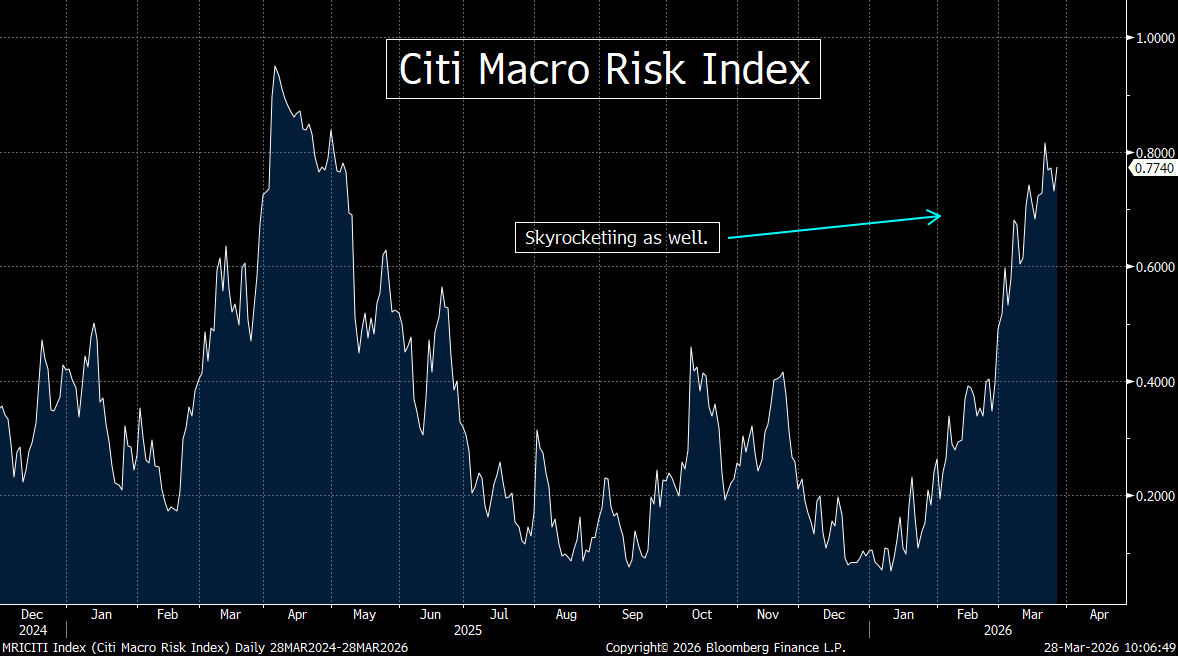
---2) The problems in the private credit market are much more than just a liquidity mismatch. “It’s not just a crisis of confidence; it’s a crisis of really bad underwriting.”…..We’d also note that the issues in the credit market are not just associated with private credit…as 50% of investment grade public bonds are one move away from junk status……This does not have to be something that becomes a systemic problem for it to create headwinds for several different asset classes.
When it comes to the rising stress in the credit market…one of the frequently cited narratives on Wall Street right now…is the idea that the problem with private credit is merely question of a liquidity mismatch. These private credit funds only have quarterly redemptions…and they limit how much anyone can redeem at one time. This is due to the funds holding longer-term (hard to sell) loans. If they get too many redemptions, the investment firms will have to sell their assets at a big discount.
This is indeed becoming a problem now…because the retail investors (who is used to being able to redeem their money immediately from mutual funds or public stock/bond accounts) are frustrated (and worried) about not being able to do so with these private credit/equity funds…..Is this really THE problem that is causing the increase in stress? As Larry Fink stated recently, these redemption restrictions are written at the very beginning of the agreement…so there should be any questions about what they involve.
Thus, in our opinion, the liquidity mismatch, is not the real problem. What really started the problem was the fact that that some key bankruptcies this past summer…followed by the writing down of loans (from 100 cent on the dollar to zero in a matter of weeks) for some other firms in the first part of this year. Also, the very large drop in the stocks of many software companies…which have a lot of private debt…added greatly to the concerns of investors of all stripes…not just individual investors. It is due to THESE issues that the redemptions begin. (It’s not a chicken/egg debate.)
However, we would also add that what is getting much less attention around the Street is that these products do have some of the same issues that the MBS’s did two decades ago. First of all, the lending standards falling in a meaningful way. Yes, there is plenty of evidence that these standards weren’t as low as they in the years leading up to the Great Financial Crisis…but they is also lots of evidence that the standards were not what they should have been.
However, some of the other similarities are more glaring. For instance, for many funds, their success is dependent on packaging the fund and collecting a fee…not on the returns the fund generates. In other words, many of these firms make their money by merely pulling in assets, not creating strong investment performance……We also have the issue of rehypothecation (remember that one?) …where the same collateral is pledged and repledged…..In other words, since the number one way to make money in this market is to bring in more assets…rather than invest the assets effectively…it opened this asset class to become managed with lower standards than they should have been.
Also, it is very hard to trust the “marks”…the pricing…that these firms claim for their assets. The big problem when it comes to this issue is that there is very, very little price discovery going on. Their loans are worth what they say they are…or what somebody they are paying say they are. How do you think that some of these loans have recently fallen from 100 cents on the dollar…to ZERO…in just a matter of weeks???
Therefore, we strongly believe that this situation is much more than a “liquidity mismatch.” Instead, we agree with the plethora of very well-respected Wall Street executives…like Jamie Dimon, Boaz Weinstein, Rodgin Cohen, Michael Gross, Jae Yoon, Jim Zelter, and Jeff Gundlach…who have been warning about the credit market for weeks now. However, we think Christian Stracke of Pimco put it best when he said, “There is a reckoning going on right now. It’s not just a crisis of confidence; it’s a crisis of really bad underwriting.”
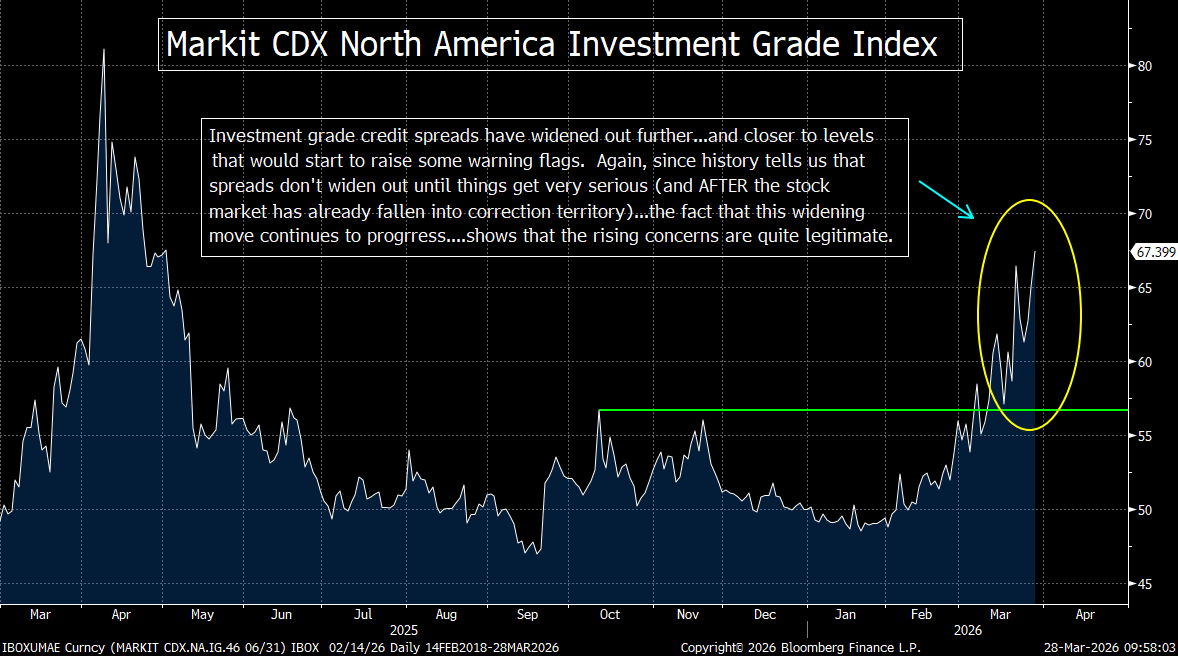
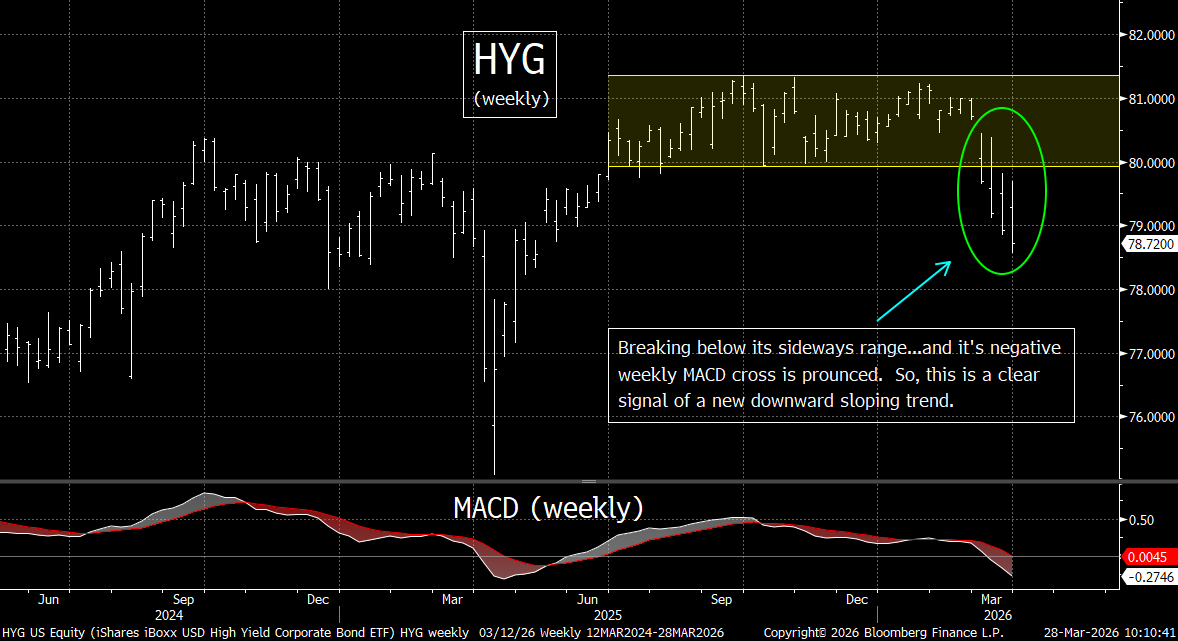
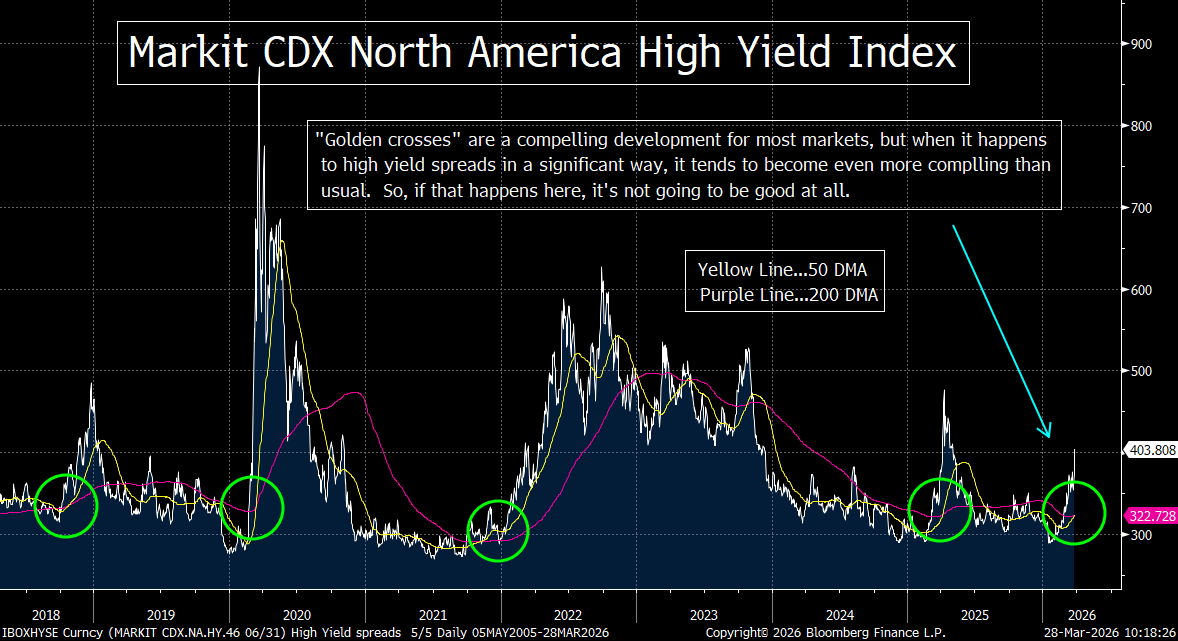
It’s also important to point out that the growing problems in the credit market are not isolated to private credit. There are also key issues to consider in the public credit market. First of all, the HYG high yield ETF is breaking down quite badly from its multi-month sideways range…and high yield credit spreads are widening out even further…..The same is true for investment grade spreads…..Also, given that a full HALF of investment grade debt is rated BBB today (vs. 1/3 just before the GFC), any broad string of downgrades will push A LOT of corporate debt down to junk status. Since many institutional investors cannot own junk paper in their portfolios, that could act like a big margin call in the credit market!
We keep reading that the issues facing the credit market today are not a systemic threat. The problem is that even it his is indeed the case, it does not mean that it won’t have a very negative impact on the price of risk assets. As we keep saying (ad nauseam), you don’t have to have a repeat of the GFC (a systemic breakdown)…for a downturn in the credit market to create significant problems for other risk assets…like stocks…especially since the stock market is still very expensive!
(We have updated all of the charts we have posted recently regarding this issue just below. The updated description of the situation is worded within each chart.)
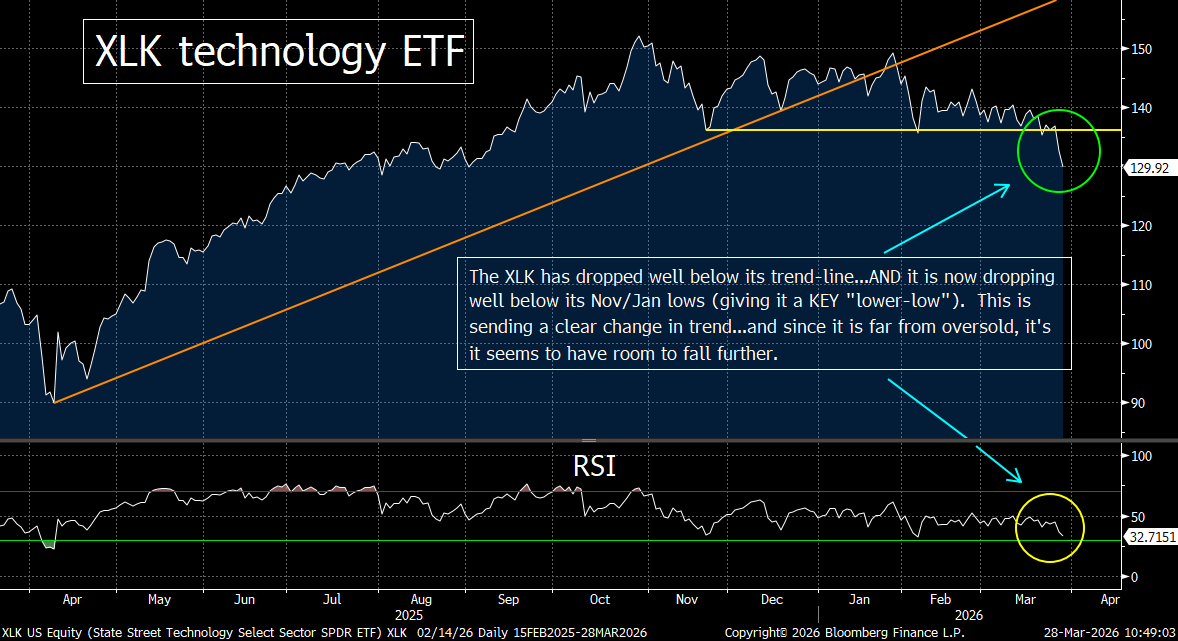
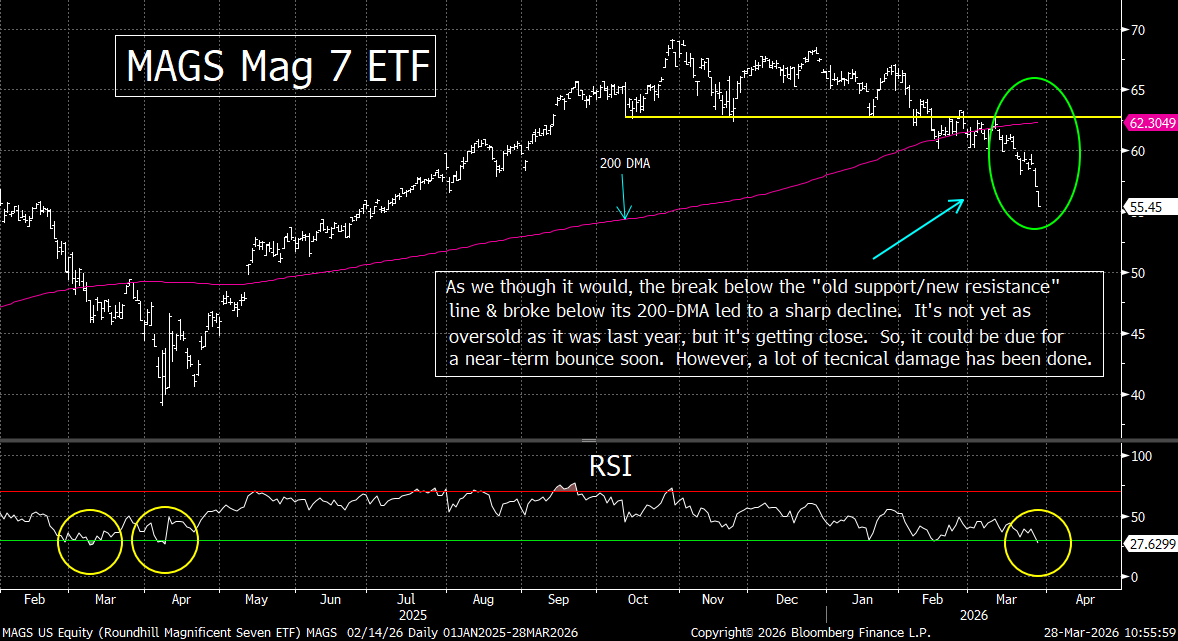
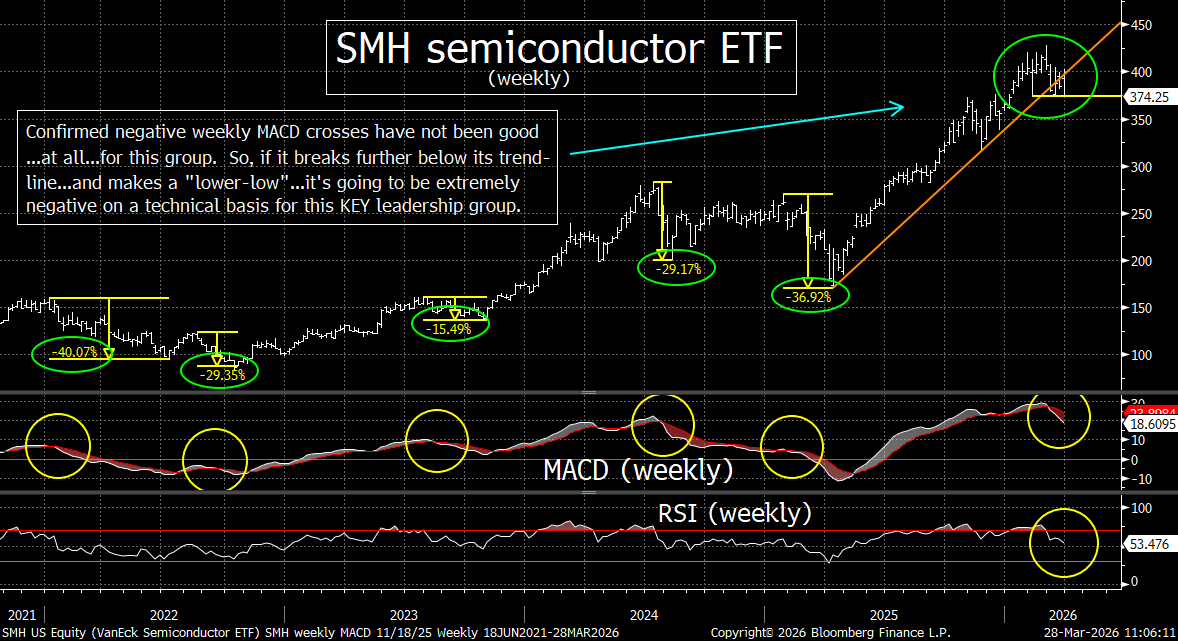
---3) Some important technical damage was done to the tech sector last week…and much of it took place due to some new (negative) fundamental developments. If we see any further weakness in the chip stocks, it’s going to raise a big warning flag on the tech sector. If that happens, you can forget about “rotation” keeping the broad stock market from falling further.
As pretty much everybody knows by now, the tech stocks got hit quite hard last week. Actually, the group starting the week or a strong note…as the XLK technology ETF had risen by 1%...and the SMH semiconductor Index has jumped by 3.7%...as of Wedneday’s close! HOWEVR, everything turned south in a substantial manner starting on Thursday.
Google (GOOGL) announced a new memory algo called TurboQuant…which will allow for more efficient use of storage needed for AI development by reducing the amount of key value cache required for AI workloads. The memory chip stocks (like Micron, Western Digital, Sandisk, etc.) were hit especially hard…and the semiconductor equipment manufacturers (like Applied Materials, Lam Research, KLA, etc.) saw significant declines as well. This caused the SMH semiconductor ETF to drop by 4.5%...which took it back down to its key support level (its 100-DMA).
However, this was not the only negative news that the tech sector received yesterday. META and YouTube (which is owned by GOOGL) were found negligent in the landmark social media addiction trial. META dropped 8% and GOOGL fell 3.4%, so you can see that although the weakness in the stock market yesterday was not broad…it was QUITE broad in the tech sector.
This is important. As we have been saying for some time now, if the tech sector begins to decline in a broad and meaningful way, it will create substantial headwinds for the overall stock market. They are just too highly weighted in the SPX and NDX for this not to be the case. Yes, the “rotation” into other groups that CAN take place if the tech stocks are moving sideways (or only falling very mildly)…BUT if the group declines in a broad and meaningful way, the indices WILL decline…and investors will start “rotating” towards cash. The likelihood that a rotation toward cash will take place is particularly true given all of the talk about bubbles in the last year…and, of course, with the war going on in the Middle East.
What we’re saying is that although the war in Iran is obviously the most important issue for the markets right now, the tech group is seeing the kind of headwinds that would be causing this sector to decline…even if the price of oil had not skyrocketed over 80% since January.
Probably our biggest concern is the recent breakdown in the SMH semiconductor ETF. For a long while, a lot of investors had been thinking that the demand for chips is not going to subside any time soon…even if the hyperscalers (and others) don’t make a lot of profits from the AI phenomenon. However, the rapid implementation of artificial intelligence (AI) and machine learning (ML) across the semiconductor value chain is poised to become a major disruptive force…fundamentally altering industry structure, competitive dynamics, and traditional business models. While AI has historically been a key driver of semiconductor demand, it is now increasingly reshaping how chips themselves are designed, developed, and manufactured.
First, advancements in AI-driven design tools are dramatically improving efficiency across the chip development lifecycle. Machine learning algorithms can now automate complex and labor-intensive tasks…such as floor planning, placement, routing, and verification. These tools can iteratively test and optimize designs, often achieving superior power, performance, and area (PPA) outcomes compared to traditional human-led processes…and doing so in a fraction of the time. In some cases, AI systems can complete design optimizations in hours that previously required weeks or months of engineering effort.
This shift has profound implications for cost structures. Chip design…historically accounting for more than half of semiconductor R&D spending…is becoming significantly less resource-intensive as AI reduces the need for large engineering teams and compresses development timelines. As a result, AI is lowering both the cost and complexity of developing advanced semiconductors, which could erode one of the industry’s most important barriers to entry.
Second, the democratization of AI-powered design tools is expanding access to semiconductor innovation. Cloud-based AI-EDA platforms allow smaller firms to design sophisticated chips without the extensive infrastructure or expertise previously required. This trend is already enabling companies outside the traditional semiconductor ecosystem…such as hyperscale cloud providers…to design their own application-specific integrated circuits (ASICs), reducing reliance on third-party chip suppliers.
As barriers to entry fall, the competitive landscape is likely to become more fragmented and dynamic. Startups leveraging AI-native design approaches are emerging with the potential to challenge incumbent EDA vendors and chipmakers. At the same time, large technology firms are vertically integrating into chip design…further disintermediating traditional semiconductor suppliers and pressuring their long-term demand outlook.
Third, companies that most effectively integrate AI into their design and manufacturing workflows are likely to gain a significant competitive advantage. AI-driven tools enable faster time-to-market, improved design quality, and lower production costs. This allows firms to produce higher-performance chips with fewer iterations. Additionally, AI enables continuous learning across design cycles, meaning each successive generation of chips can be developed more efficiently than the last.
Finally, AI is fostering a self-reinforcing dynamic within the semiconductor ecosystem. As AI improves chip design, it enables the creation of more powerful AI chips…which in turn accelerate further AI advancements. This feedback loop is compressing innovation cycles and increasing the pace of disruption across the industry.
Like we did in point #1, we have provided some updated charts on the tech sector ETFs below. The updated description of the situation is worded within each chart as well.)

---4) As rough as the market has been during March, the decline has been nothing more than we usually see at some point in every year. So, this could just be seen as a normal and healthy respite…before the market returns to rally mode. Earnings are good…the economy remains resilient…and we could see more positive liquidity flows as we move through 2026.
Despite heightened geopolitical risks stemming from the war in Iran…there are certainly several fundamental factors support a constructive outlook for U.S. equities in the near- to medium-term. First, and foremost, the outlook for corporate earnings remains resilient. Pre-conflict surveys of U.S. CFOs indicated expectations for roughly 5% revenue growth and continued hiring gains. This underscores solid underlying demand and pricing power across corporate America. The fact that earnings estimates have actually risen over the past several weeks…with the consensus now looking for 16% growth for earning on the S&P 500 this year.
Second, the United States’ position as a net energy exporter…acts as a key differentiator versus other major economies. While higher oil prices are a headwind for consumers, they simultaneously support investment, profits, and employment in the domestic energy sector…offsetting some of the broader economic drag. This dynamic is particularly important relative to Europe and parts of Asia…which remain heavily dependent on imported energy.
Third, U.S. equities benefit from a more domestically oriented revenue base. Compared to many international markets, a larger share of S&P 500 revenues is derived from within the United States…insulating earnings from global disruptions tied to the Middle East conflict or weaker foreign growth.
On the macro front, the labor market remains relatively stable. While job growth has moderated, unemployment remains near historically low levels and layoffs are still subdued…reflecting a “low-hire, low-fire” equilibrium. Wage growth continues to modestly outpace inflation, supporting real incomes and consumption.
Consumer fundamentals also remain supportive. Although confidence has softened recently, U.S. consumption continues to be underpinned by solid household balance sheets and income growth. Broader forecasts still call for moderate GDP growth around 1.8%–2.2% in 2026, highlighting the economy’s resilience. Retail spending and services activity…while uneven…remain in expansion territory……Also, manufacturing activity has shown pockets of improvement…even amid recent volatility…suggesting that the industrial side of the economy may be stabilizing.
Monetary policy might also provide a potential tailwind for stocks…when the new Fed Chief takes over (soon?). While the Federal Reserve remains cautious in the near term, many economists still expect rate cuts later in 2026. Yes, Fed Funds Futures have begun to price-in a 50-50 chance of a rate hike this year…it’s hard to think that a rate hike will take place just before the election.
Finally, the ongoing AI-driven investment cycle represents a powerful structural tailwind. Strong capital spending tied to artificial intelligence is expected to boost productivity, enhance margins, and support long-term earnings growth. Over time, these productivity gains could offset cyclical pressures and extend the current expansion.
---5) The major stock indices all broke below the key support levels that we have been harping on since the market started to slide lower at the beginning of this month. The SPX and NDX are starting to reach oversold levels on their daily charts, but not on their weekly charts. Also, they have certainly become more oversold on both charts before they have bottomed many times in the past…..Therefore, we could see a bounce at any time, but the line of least resistance is to the downside on a technical basis…and the trend for the market is now bearish.
Last week’s weakness in the stock market…which came became significant on the last two days of the week…took the S&P 500, the NDX Nasdaq 100, and the Russell 2000…all below the support levels we have been highlighting recently. The SPX and NDX broke below all of the support levels we’ve highlighted, but the Russell is still holding above one of them. That said, the small-cap Russell 2000 is not particularly close to becoming oversold (like the other two have), so we could see some underperformance next week if the decline continues.
It is interesting to note that there has not been any sign of “capitulation” or a “washout” move. We frequently see that kind of high intensity drop (with huge volume and horrible breadth) before a market sees an ultimate bottom. However, it does NOT always see a capitulation move when the market bottoms. In fact, in the bear market of 2022…when the S&P dropped 25% and the Nasdaq declined 35%...there was no sign of capitulation. The market made a bottom without much fanfare…and slowly (but surely) reversed its momentum back to the upside over several weeks. Therefore, we could certainly see a bottom without any “washout” move this time around as well.
We would also point out that if we see some sort of bounce soon, it won’t necessarily signal that THE bottom has been made. The past several weeks has seen the market hold up…and even advance…early in the week…only to rollover and take us into negative territory for the week by Friday’s close. (As we’re sure you’ve all heard by now, the stock market has closed lower each of the last five weeks.)…..As some point these recent trends will be broken, but since some real technical damage has been done, the market should continue to decline…unless we get some very positive news on the geopolitical front.
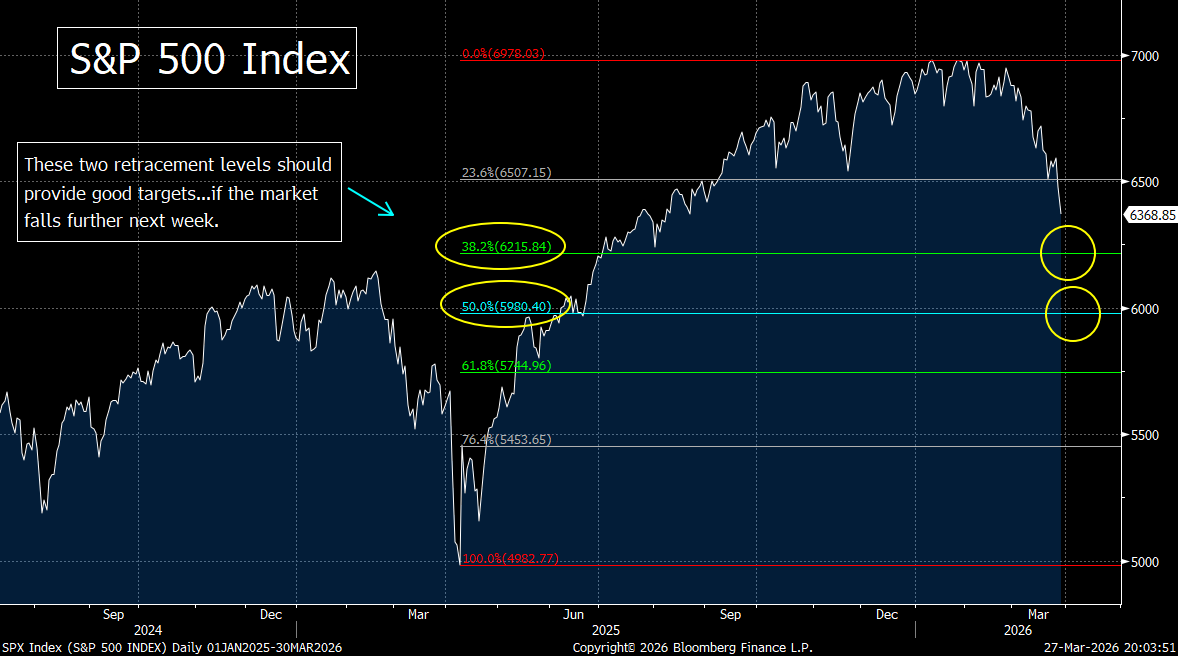
We’ll start…as we always do…with charts on the S&P 500. The first one shows that it did indeed fall below its 200-DMA…and below its key 6,500 support level (the low from both October and November). Since the drop was quite meaningful on Thursday and Friday, both of those support levels have been broken in a meaningful way. So, this is definitely negative on a technical basis…..That said, it’s getting somewhat oversold on its daily RSI chart. Thus, it could see a near-term bounce at any time. However, without some materially good news out of the situation in the Middle East, any bounce next week could/should be a short-lived one.
In the second chart on the SPX, we have provided some possible near-term targets. The first one is 6,215…which is a Fibonacci 38.2% retracement of the entire rally from last April’s low. Next support comes in at the 50% retracement level…down at 5,980. Of course, if that level is broken, there could be plenty of further downside potential…especially if things deteriorate badly in the war.
HOWEVER, if the market does become more oversold…and especially if we see signs of real capitulation…especially if it comes while it’s testing that second support level…it could (repeat, COULD) be an excellent buying opportunity. Remember what we said back in February: Even though the market tends to see major declines which bottom in October, they ALSO see some outsized drops that bottom in March or early April! (Much like last year’s did.) Therefore, as much as we worry that this decline could turn into a drawn-out affair, we will stay extremely nimble over the next couple of weeks……Having said this, the rebound in March of 2022 didn’t last very long…and what became a bear market in that year resumed after just two weeks. So, like any seasonal issue, this is not a perfect one!
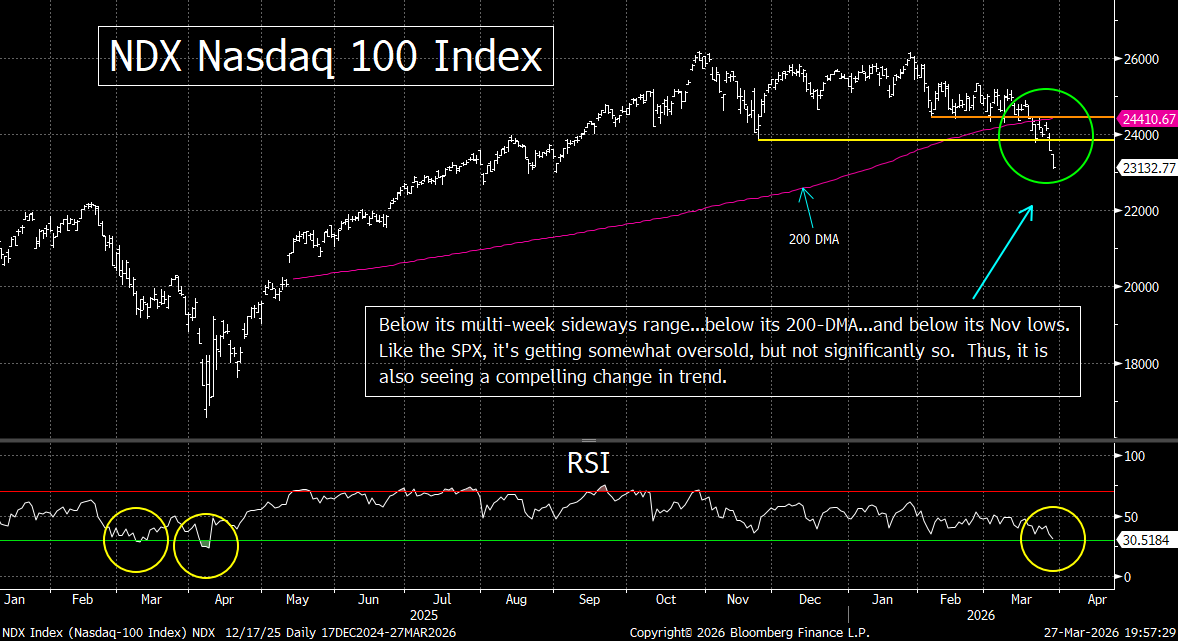
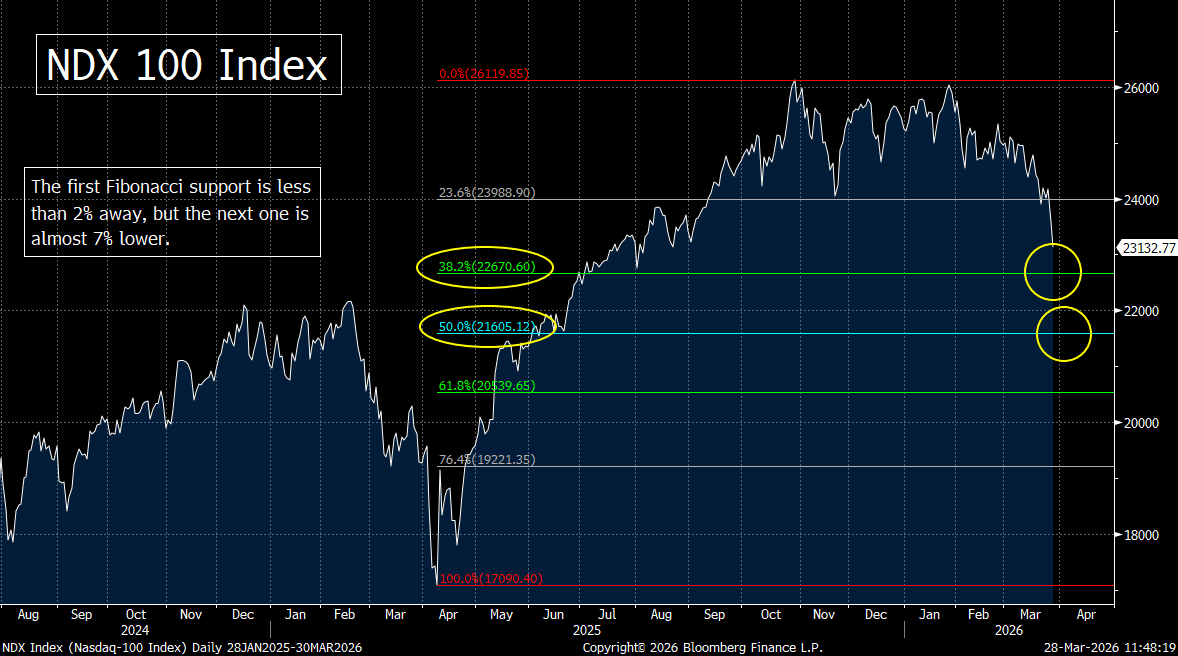
The situation is almost exactly the same for the NDX Nasdaq 100 Index. It has broken well below its 200-DMA…and meaningfully below its November lows (giving it a key “lower-low”). Like the SPX, it is getting somewhat oversold, but it has definitely become more oversold many times in the past before it has bounced (not to mention…before it has established an important bottom). Therefore, we believe that the line of least resistance is lower after these important support levels have been broken…BUT we want to keep the above-mentioned “seasonality” issue in mind…and thus, we will remain quite nimble going forward……..As for the near-term target levels, we have the first one at the Fibonacci 338.2% retracement level (of 22,670) and the 50% retracement level (of 21,605)…..(Second chart below.)
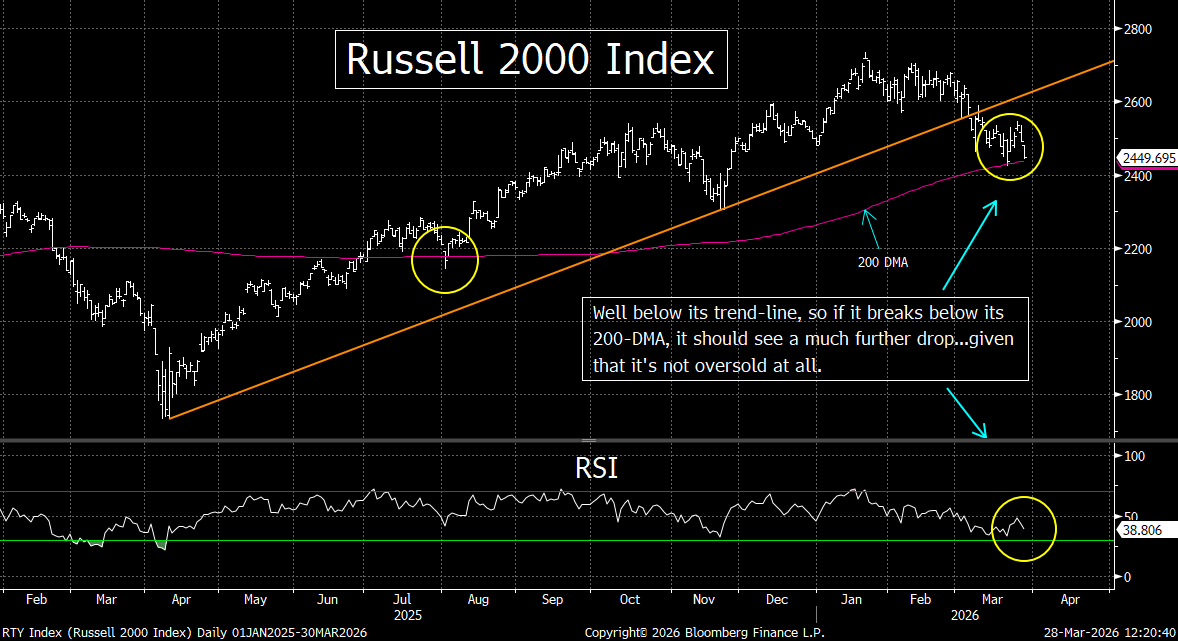
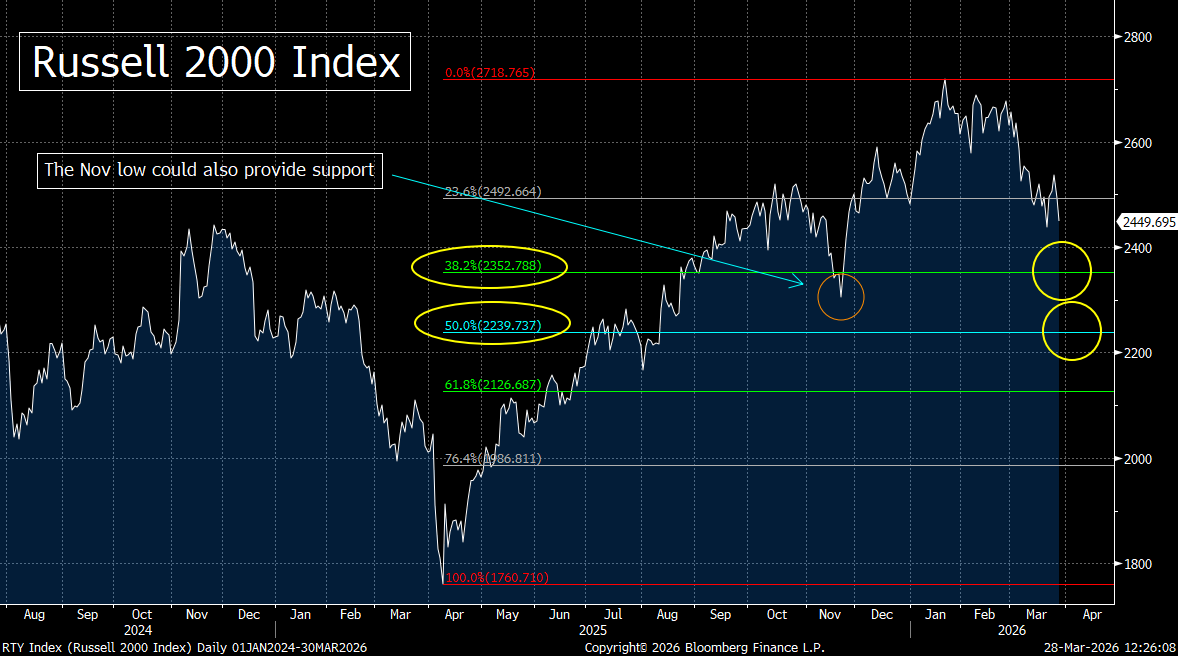
Finally, for the Russel 2000, it has broken well below its trend-line from last April. HOWEVER, it has NOT broken below its November low OR its 200-DMA. So, that is somewhat encouraging. That said, it’s not oversold at all. Thus, if it does break below that 200-DMA next week, it could get pummeled pretty good……As for its target levels if it does indeed break below that 200-DMA: First support is the Fibonacci 38.2% retracement level of 2,350…and then the 50% retracement level of 2,239. (Of course, the same seasonal issues apply with this as well.)
---6) The Treasury market had a tough week last week…as interest rates pushed higher once again. It was not just long-term yields that pushed higher. The yield on the US 2-year note also broke above some very important resistance levels. So, although we don’t see rate hikes this year, the 2yr note is the best indicator for what the Fed will do in the future…so we cannot discount that possibility. Either way, we’ve seen a confirmed change in trend for bonds on a technical basis.
It was a very rough week for the Treasury market last week as well. (Of course, that is one of the reasons why the stock market got hit so hard.) Needless to say, the rise in oil prices…back up to their highs for this move…raised fears about inflation. It’s not just the flow of oil that has been curtailed in such a big way, but the same has been true for other items (like fertilizer). This caused markets to dramatically reprice the expectations for what the Fed will do over the rest of this year. In fact, the odds of a rate HIKE by October rose to 50%...and it caused many economists to shift their expectation for the next cut…out to September.
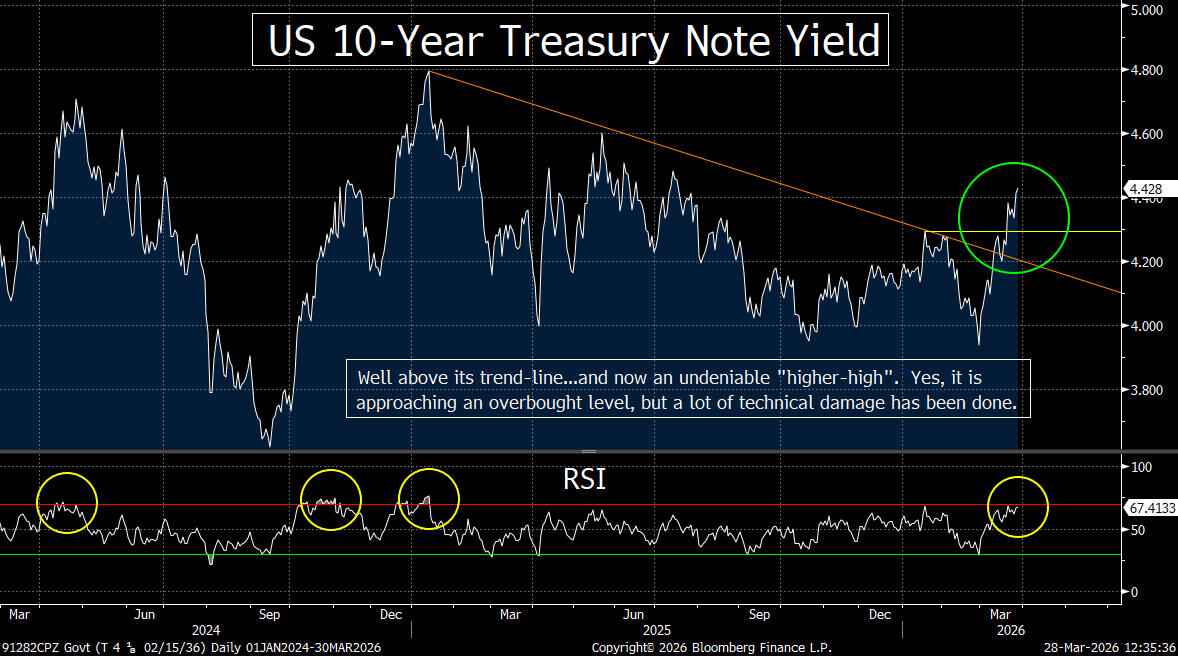
The rise in long-term yields took the 10yr yield WELL above its 15-month trend line…and well above its January high. So, not only did it push above 4.3%, but it closed above 4.4% for the first time since last summer. Therefore, this is confirming an important change in trend for long-term interest rates…and it will take some substantial news to reverse this trend.
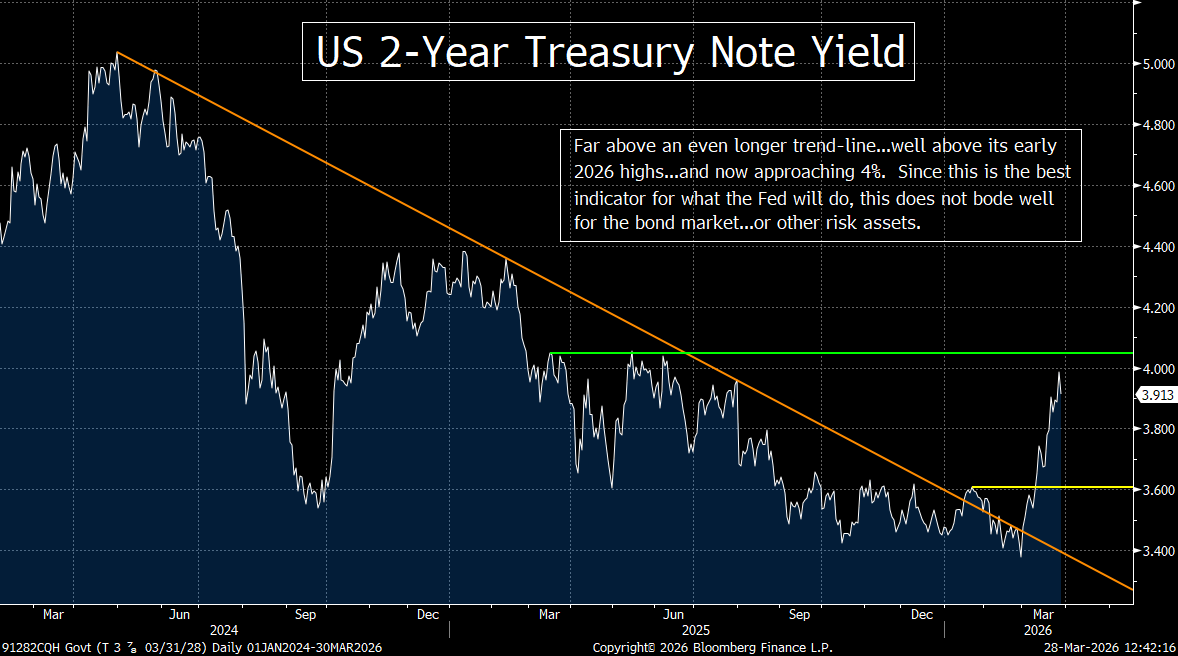
To be honest, we believe the odds that the Fed will hike rates this year are quite low. However, we also realize that the Fed actually merely does what the market has already done for them in the end. One of the best indicators for what the Fed will do is the movement on yield of the US 2-year note. This shorter-term yield is also rising in a material way…and it is signaling a change in trend as well. It has broken above its trend-line going all the way back to 2024…and has now done so in a major way. It has also pushed WELL above its January highs…and is even getting close to testing its spring/summer highs of last year. So, it has signaled an important change well.
In other words, if the yield on the 2-yr note remains elevated…and especially if it continues to push higher…it’s not out of the question that the Fed could indeed hike this year. (Again, that is not our base case, however.)
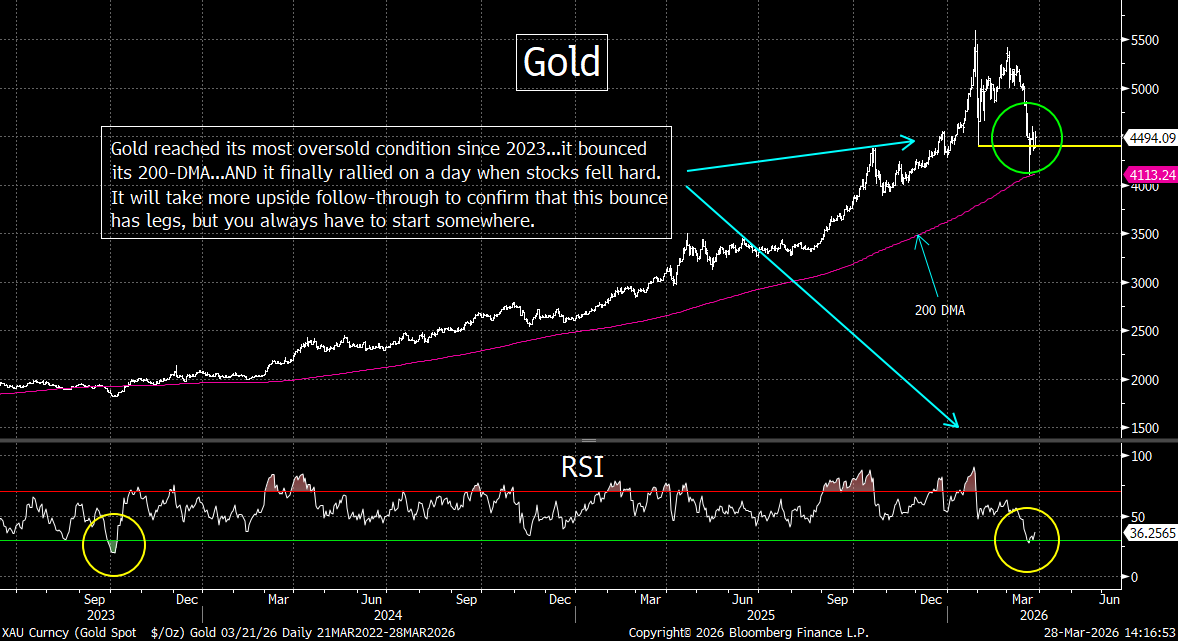
---7) Well, believe it or not, some of the haven assets started acting like they usually in the second half of last week. After weeks of not having anywhere to turn, investors finally started buying some traditional save havens on Thursday and Friday of last week. As we just mentioned, US Treasury notes and bonds were not one of those havens that they purchased…but we finally did see some outperformance in the precious metals and defensive groups like the consumer staples and utilities. That said, we’ll need to see more action like we did last week to confirm that these assets are indeed seen as safe havens again.
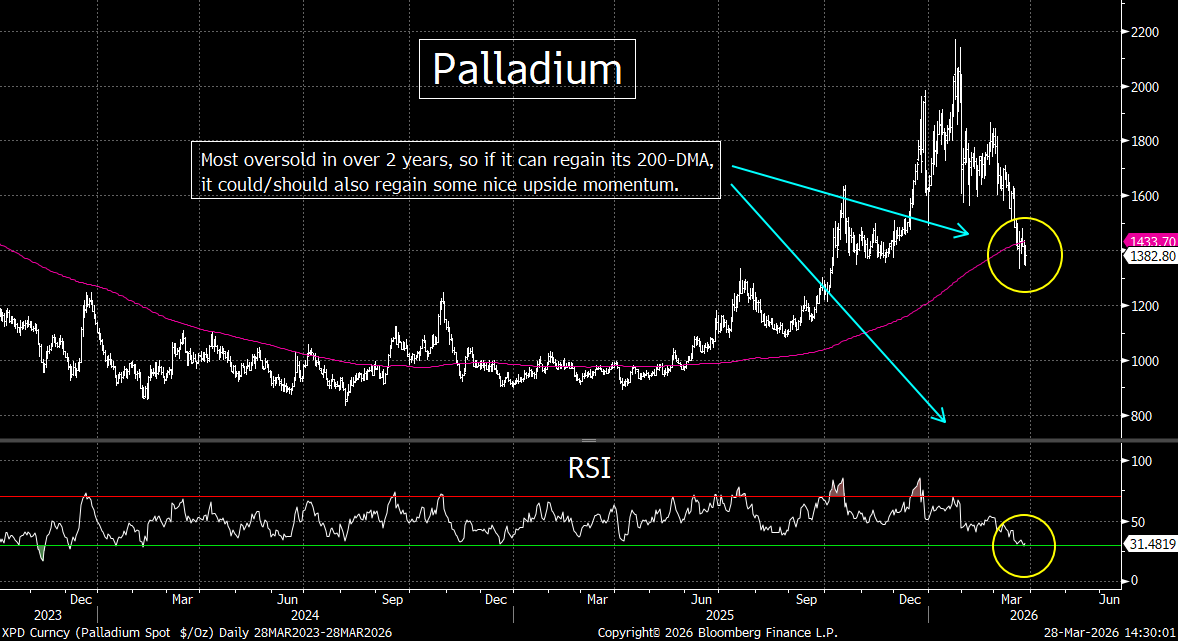
We highlighted how gold had become quite oversold last weekend, so we were not surprised that it finally rallied during the late week decline in stocks (and rise in crude oil). Not only was gold oversold, but so was palladium…and although silver and platinum were not as oversold, they still bounced quite nicely late last week. Like gold, platinum had also reached an oversold level…and thus those two might have the most upside potential. However, all of them are looking like they are poised for another leg to their longer-term bull market……Having said this, we are going to have to see more upside follow-through before we can declare that the trend for this asset class has returned to the upside.
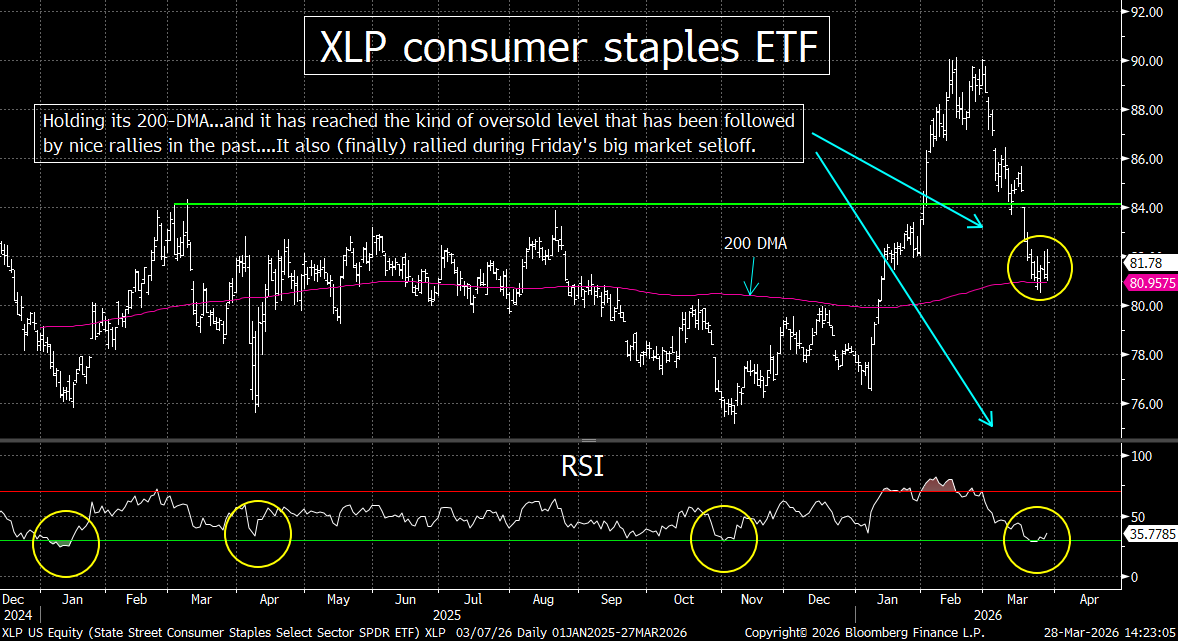
It’s interesting to note that the utility group rallied every single day last week, so that one is looking more and more like a good defensive play. As for the consumer staples, the XLP consumer staples ETF bounced off an oversold condition late last week…and is now trying to regain its 200-DMA. If it can indeed regain that line in a material way, it will give us a lot more confidence that this group can outperform going forward.
One last comment about the consumer staples. Whenever it reaches the kind of oversold condition it did early last week, it tends to rally quite nicely…no matter what the rest of the market does. Therefore, this group could actually be a win/win situation for investors. If the broad market keeps declining, this sector should outperform…and if the market bounces, this sector should be able be able to keep up in a surprising manner.
---8) It is no surprise that Europe is feeling the pinch from the decline in supply of global oil and gas. This has caused their equity markets to go from outperformance over the first two months of the year…to material underperformance over the past month. The longer the war goes, the more pronounced this will become……We’ll be watching the European bank stocks. They are testing a VERY important support level. So, if they fall much further, it’s going to create some real problems for this important sector.
After outperforming over the first two months of the year, European stocks have underperformed the US market since the war began….as the ongoing war involving Iran is having a pronounced and increasingly negative impact on Europe. The primary reason for this is the renewed energy shock…disrupted transportation networks…and deteriorating economic sentiment. The region…still recovering from prior energy crises…is particularly vulnerable due to its reliance on imported oil and natural gas.
As it has for the rest of the world, the conflict has driven a sharp rise in energy prices. Brent crude has surged above $110 per barrel, while European natural gas prices have nearly doubled in recent weeks amid supply disruptions and the near-closure of the Strait of Hormuz. Europe’s dependence on imported fuel…particularly liquefied natural gas (LNG)…has amplified the shock, especially as Qatari LNG shipments have been curtailed.
Looking forward, energy prices are expected to remain elevated and volatile. Policymakers warn that if the conflict persists into late 2026 or beyond…the energy shock could extend into 2027. This would prolong inflationary pressures and weakening growth. Even in moderate scenarios, oil prices could remain near $100 and gas prices significantly above historical norms.
The war has severely disrupted aviation across the Middle East. Multiple countries have closed airspace, forcing European carriers to reroute flights, increasing travel times, fuel costs, and insurance premiums. Air cargo capacity has also declined sharply, contributing to higher freight costs and supply chain bottlenecks…particularly for time-sensitive goods.
Europe is increasingly facing stagflation risks. Higher energy costs are feeding directly into consumer prices…with eurozone inflation expected to rise toward or above 4% in some scenarios. At the same time, economic growth is slowing materially, with some forecasts pointing to stagnation or even technical recession in major economies.
Business and consumer sentiment have deteriorated sharply. Eurozone consumer confidence has fallen to its lowest level since 2023, while business activity surveys show a marked slowdown, reflecting weaker demand and rising input costs. Energy-intensive industries are already cutting output or raising prices…further weighing on economic momentum.
Politically, the crisis is increasing pressure on European governments to intervene through subsidies, energy diversification, and defense spending…potentially widening fiscal deficits……..For the European Central Bank (ECB), the war complicates policy significantly. While growth is weakening, rising energy costs are pushing inflation higher, limiting the ECB’s ability to ease policy. Officials have signaled readiness to act if inflation becomes entrenched, with markets increasingly pricing in the possibility of rate hikes rather than cuts.
Last weekend, we highlighted how the STOXX Europe 600 Index could see a strong bounce…if things calmed down in the Middle East. Since they haven’t calmed down…and the war now seems to be looking like it will last for some time…that bullish scenario has flown out the window. Of course, there will be bounces from time to time…maybe even rather big ones. However, unless the next surge from the US and Israel is something that ends this war quickly…and reopens the Strait (which IS possible)…the underperformance for European stocks will likely continue.
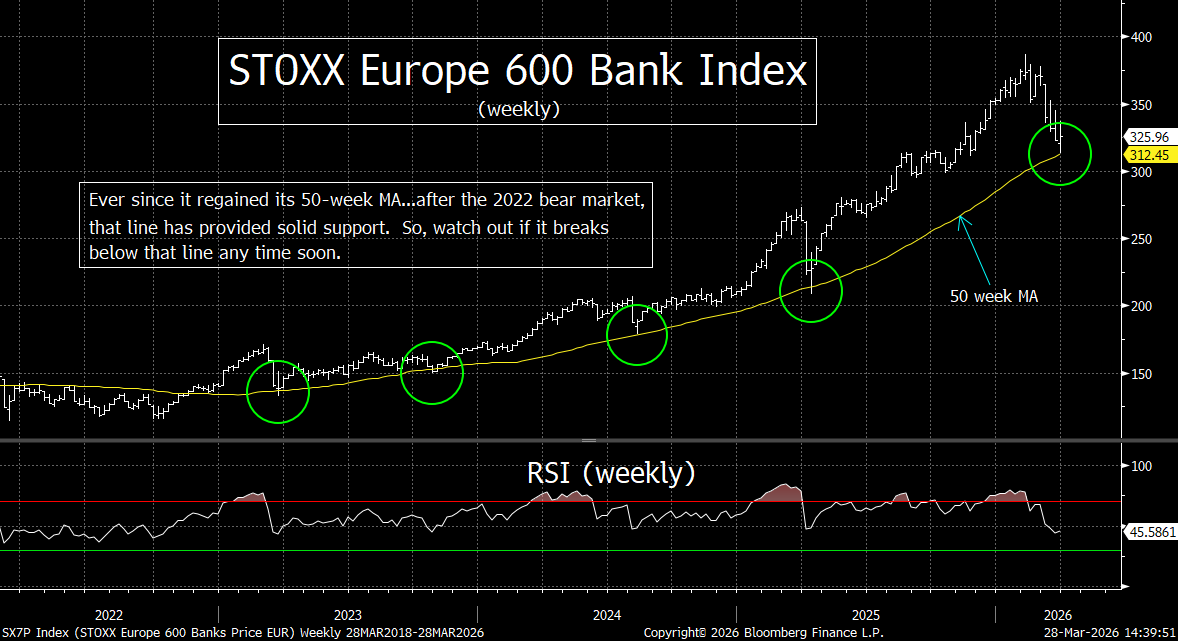
We’ll be watching the bank stocks in Europe for more clues. The STOXX Europe 600 Banks Index is has rolled over and dropped 15%. This decline actually began in early February…several weeks before the war began. (There has been some chatter about large short positions in silver for the European banks for some time now.) This extended drop has taken the European banking index down to its 50-week moving average.
The 50-week MA has provided excellent support for this index ever since it regained that line following the bear market of 2022. Therefore, if it breaks below that line in any significant way, it’s going to send up a bigger warning flag on this group than already existed. That, in turn, would raise more concerns about the European stock market in general. The bullish consensus around the Street on Europe has certainly reversed since the war started. If their bank index breaks below its key support level, these new concerns should rise in a material manner.
---9) Potpourri………As we usually do each week, we have put together some very quick thoughts on several other issues again this weekend. Some of bullet points have to do with the markets…while others have absolutely nothing to do with them. We hope you find them either interesting, thought provoking, or simply just fun.
---The XLE now has its most extended overbought reading on its weekly RSI chart…ever. We’re still bullish on the energy stocks, but they could/should see a decent sized short-term dip at some point soon.
---Heard the song, “Get into the Groove” by Madonna on the car radio today. I had forgotten how good her early stuff was.
---There is nothing…and we mean NOTHING…better than the springtime in Boston…all three days of it…….(How can the fall season be so awesome…and the spring season suck so badly…except for about 3 days)?????
---For some reason, we just cannot shake the feeling that world is going to be a much different place a month from now. We just don’t know if it will be a lot better off…or a lot worse off.
---The Euro has the largest weighting in the DXY dollar index (by far). So, the chart below might say more about the euro than the dollar…but there is no question that the DXY is testing an extremely important resistance level.
---10) Summary of our current stance………..We have spent the past several weeks talking about how the risk/reward equation in the stock market was weighted dramatically towards the side of risk. Given that the stock market had dropped just a 3%…and then 5% (last weekend)…after a MAJOR spike in oil prices (as well as the concerns surrounding the AI industry and the private credit market), we felt that the stock market had the downside risk of 20%...and the upside potential of just 5% or so. Of course, now that the market has fallen further, the risk-reward equation is not as bad as it was a week ago. However, since the odds of a recession…or at least a material slowdown in growth…are moving higher, we still think there is more potential risk than potential reward right now.
Our biggest concern is that the war in the Middle East is going to last longer than most people are thinking (and more than the market is pricing in). Therefore, we worry that the economic outlook…and thus the earnings outlook…will turn south soon. We also believe that since the market is still very expensive, the last thing the market needs is a reversal in earnings expectations.
However, we are also very concerned about the fact that there are two other issues which could create problems for the stock market…even if the situation in the Middle East calms down quickly. First, it is becoming more and more evident that the AI phenomenon is not going to create the kind of broadly dramatic increase in earnings for the tech sector that the market has been pricing in for a couple of years now. Second, the problems facing the private credit market…AND other areas in the credit market…is something that could have a negative impact as well.
What particularly bothers us is that SO MANY people on Wall Street keep telling us that these issues are not something investors need to worry about…because they are not as bad as other similar incidents in the past for these three subjects. They said that since this oil shock will not be as bad as the 1970s oil shock, it’s nothing to worry about…and everything will go back to normal quickly. They’ve been saying the same thing about the AI bubble…and that it’s not as big as the internet bubble of 25+ years ago. Finally, they also say that what is going on today in the credit market is not as bad as it was in 2007/08…and thus it does not pose any systemic risk.
The problem with this thinking is that just because these issues are not as bad as they were in the worst blowups these issues have provided in a generation…does not mean they won’t create some meaningful problems for the markets…….Look, in the three examples we just mentioned, the S&P 500 declined 50% in each case. Therefore, the only thing these people are saying when they state that these issues are not as bad as the worst examples of the past 50 years…is that the S&P 500 is unlikely to fall 50%!!! We’re sorry, but that should offer little solace for investors…given how expensive the market still is today.
We must admit that we understand why people would think that anything less than a total disaster is a reason to remain bullish. Let’s face it, the 35% decline during the pandemic was completely erased in six months…and last year’s deep correction was erased in less than five months! Also, the expectations for renewed liquidity injections (both monetary and fiscal) probably make many of these people believe that we can see the same kind of revival this time around…..In fact, we do agree that this is entirely possible. (We also agree that we don’t have to see a big “capitulation move to form a bottom. We certainly didn’t get that at the end of the 2022 bear market.)
However, we’d also note that it took two full years for the 2022 bear market to recover all of its losses. On top of this, there are plenty of examples in the past where the spike in oil prices…a significant reversal in the tech sector…and some meaningful problems in the credit markets…have been followed by periods of meaningful weakness in the equity market…even if it did not involve a recession …….With all of this in mind, we think investors should be playing today’s markets more defensively than they have up until now…especially if it looks like the war in the Middle East will become something of a protracted conflict.