The tech stocks were able to continue to push higher yesterday (after Monday’s very large advance), so the upside momentum for this key leadership group remains intact.
As we thought they would, the energy stocks have seen a material short-term pullback, but the group is quickly looking quite enticing once again (already).
The weakness we in the bank stocks we highlighted a month ago has continued…and they are now testing a very important support level.
The stock market was able to digest its strong gains from Monday quite well yesterday…as the S&P 500 finished the day flat…and the NDX Nasdaq 100 pushed slightly higher. Even though the further advance in the NDX was relatively mild, it was enough to give it a new record high (to go along with the record that was set for the Nasdaq Composite on Monday). This means that the tech stocks moved higher once again…with the SOX semiconductor index rising 2%. So, the upside momentum for this key leadership group remains intact.
The further weakness in crude oil continues to get a lot of credit for the recent pop in the stock market. WTI crude has declined by 15% since September 15th, so our call back then…which said that crude oil has become very overbought…and that sentiment had become extremely bullish…and thus this commodity was ripe for a pullback…has worked out extremely well. Therefore, the call that we made to pullback from the energy stocks just over a week ago has also been a good one…with the XLE and XOP energy stock ETFs giving back 8%-9% over that time.
Okay, now that we’ve dislocated our shoulders patting ourselves on the back…where do we stand now? Well, the overbought and over-loved conditions have been worked off…and we definitely continue to like this group on a longer-term basis. Therefore, this sector is looking much more enticing once again. Of course, we could still see some more weakness in the group as it digests its recent decline, but we believe it is safe to start nibbling away on these stocks once again.
With the situation with both the Strait of Hormuz and the Red Sea being a constrained one…and the Saudi East-West Pipeline vulnerable to more attacks even if it reopens soon…the supply constraints remain a problem. Besides, given our longer-term bullish stance on hard assets…due to our concerns about national debts and currency dilution, we believe that a “buy the dip” mentality should be maintained for this sector…and this most recent dip should provide a good opportunity once again.
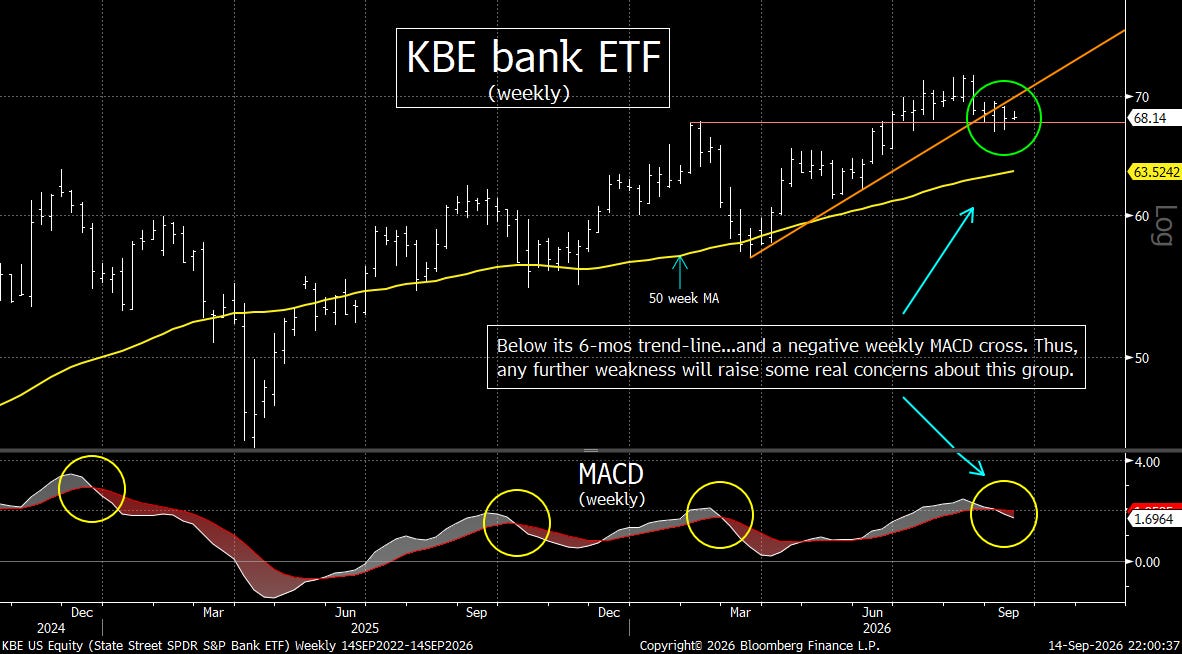
Switching gears, the bank stocks got hit hard again yesterday. This is another issue that we raised a few weeks ago…starting with comments in our weekend piece back on August 22nd…and then again in one of our daily pieces on September 15th. The decline has accelerated more recently…this has taken the KBE bank ETF down to a key support level…and any further drop will raise some warning flags on this key group.
The reasons for the recent weakness involve several issues. First, the warnings from BofA that Q3 trading revenue will be flat and that investment banking fees will fall at least 10% raised fears that the extraordinary strength in capital-markets businesses is beginning to normalize…and that other banks could face some similar pressure. Also, the fact that IPOs for Open AI and Anthropic (and several others) have been delayed has also lowered expectations on this front.
At the same time, the significantly flattening of the yield curve over the past few weeks is creating concern about pressure on net interest margins…which had already declined earlier this year. Finally, there is now a new issue: investors are beginning to wonder whether advances in AI…particularly in personal finance, investment advice and financial services…could ultimately disrupt bank business models…rather than make them more efficient…….This combination of weaker capital markets expectations, potential NIM pressure…and uncertainty about AI’s longer-term impact has clearly weighed on this group.
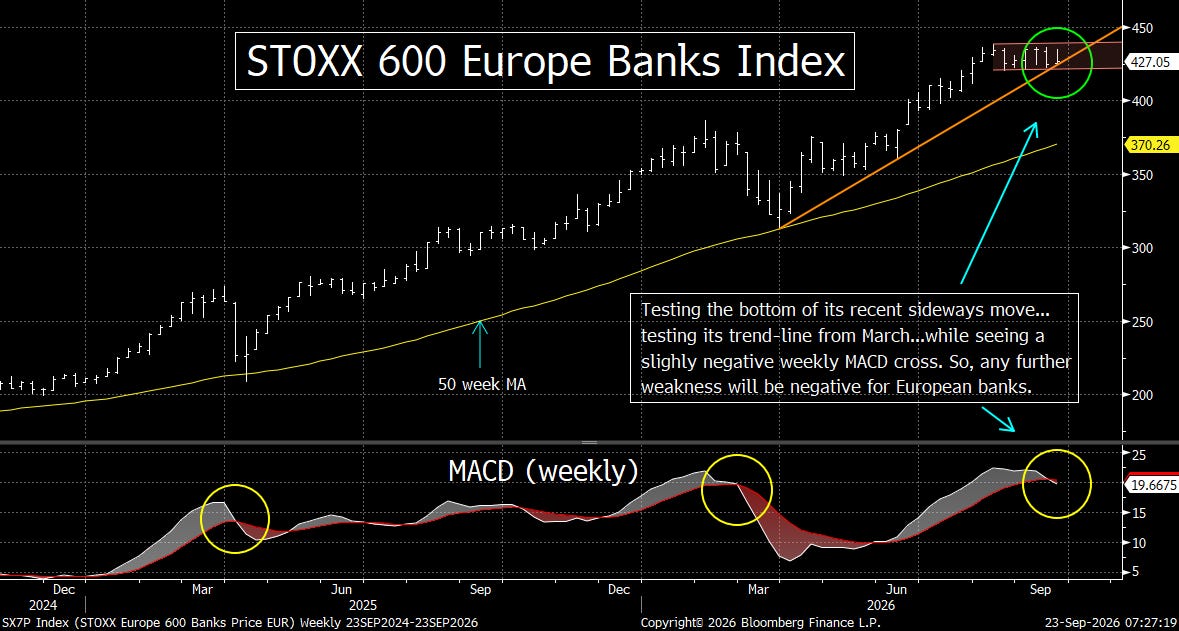
Moving back to the technical picture, we want to be more specific about the “key support” levels we alluded to above. Looking at the weekly chart on the KBE bank ETF, you can see that it has already seen a compelling negative MACD cross…and it is now testing its trend-line from March. Therefore, if it falls much further as we move through rest of September and into October, it’s going to raise some warning flags for the banking group on a technical basis. (First chart below.)……We’d also note that the same is true for the European banks…as the STOXX 600 Banks Index is testing its own key support level. (Second chart below.)……Given how important these groups are to their respective economies; it’s something investors should be watching quite closely in the days and weeks ahead.