
Since we have some new readers, we’d just want to reiterate that we always try to provide items from both the bullish side and the bearish side of the bull/bear ledger each week. However, we always let you know which side of the ledger we stand at any given time……Of course, our goal is to be correct, but another one of our goals is to help people look at the markets in a way that they would not normally look at them. So, we like to touch on many different aspects of the markets…..Thank you and enjoy the rest of your weekend!
Table of Contents:
1) Earnings are very strong. If the broaden out more than they have so far, it will be quite bullish.
2) The tech indices & ETFs are testing resistance levels. If they break above them = very bullish.
3) Many factors are causing yields to rise…and many of them are bearish for stocks.
4) A significant rise in LT yields and oil price always causes problems for stocks eventually.
5) The Treasury market is far from the only fixed income market feeling stress.
6) Update of the charts on the S&P 500, the NDX Nasdaq 100, and the Russell 2000.
7) While nobody was looking, China’s stock market has fallen into correction territory.
8) Some stocks that should outperform if the market rallies further.
9) An update on several key charts…and none of them are positive updates.
10) Summary of our current stance.
---1) The earnings backdrop remains a major bullish force…with 2026 S&P 500 estimates rising sharply to more than $340 and 2027 estimates approaching $400. However, the improvement is not as broad as it appears…with much of the strength concentrated in technology, energy and materials…while other sectors (like financials) are seeing far smaller gains or outright declines. Therefore, the upcoming third-quarter earnings season will be critical.
With the S&P 500 and the NDX Nasdaq 100 both closing the week within 1% of their all-time highs, it makes perfect sense to begin this week’s piece on the bullish side of the bull/bear ledger. As always, we like to provide issues and developments from both sides of the bull/bear ledger in our weekend piece…while still letting you know which side of that ledger that we stand on at any given time…….We’ll begin by discussing the most bullish issue in the equity market right now: earnings……Again, this issue is obviously a quite bullish one, but it is not as broadly bullish as some on the Street would like to portray it.
The earnings revision story for the S&P 500 in 2026 has been one of the most dramatic in recent memory. Consensus EPS estimates for the broad index have moved sharply higher since January…reflecting stronger-than-feared corporate execution, a resilient U.S. economy…and a significant repricing of commodity-linked earnings. Consensus is now looking for just over $340 in S&P 500 earnings for 2026…up from roughly $290 at the beginning of the year…a 17.5% increase in the estimate. Looking further out, the 2027 estimates have risen from approximately $351 to $396…a gain of more than 19%.....These are not incremental adjustments. They represent a meaningful re-rating of the expected earnings power of U.S. companies…and it has been a key reason why the stock market has rallied so strongly off the March lows.
However, beneath the index level is a story of extraordinary dispersion. The largest upward revisions are concentrated in commodity-sensitive and technology-driven businesses…while several rate-sensitive and structurally challenged sectors have seen substantial downward revisions. Interestingly…despite technology remaining one of the major leadership groups in the stock market…it is not the highest-ranking sector in terms of estimate growth for the next two years. Some of this has to do with the fact that tech estimates were already strong going into 2026, but the breakdown between sectors is still interesting.
Earnings estimates for the tech sector have increased by 28% for this year, and 53% for 2027…while the energy sector has seen their estimates jump by 85% and 40%, respectively! The material stocks have seen their estimates jump by 73% and 15% for each of the next two years…so you can see that these two sector have seen bigger jumps.
It’s also interesting to note that some groups…where Wall Street has spoken very positively on this year…have actually not seen big advances in their earnings estimates. For example, the financials have only experienced a 1.6% rise for 2026…and just 2.6% for 2027……In other words, as much as there has been a lot of talk about how the earnings growth is broadening out…it’s not as broad as some on the Street are trying to portray.
Don’t get us wrong, the rise in earnings estimates (and the actual earnings reports so far this year) HAVE broadened out. So, this IS still a bullish development……It’s just that they need to broaden out quite a bit more if the stock market is going to rally a lot further over the coming months.askb
This makes the upcoming third-quarter earnings season particularly important. Double-digit earnings growth is expected across six sectors…utilities, Industrials, Materials, Consumer Discretionary, Healthcare and Technology. Yet Financials, which investors were extremely bullish on only a short time ago…are now expected to deliver only around 2% earnings growth. That is a significant change in expectations.
There is no question that earnings have been a major driver of the stock market’s advance this year…with the major averages now close to record highs. However, we also have to remember that expectations can change very quickly when the underlying environment changes. In the first half of 2007, for example, consensus was looking for 16.2% earnings growth…only to see earnings ultimately decline by roughly 16% that year…and nearly 50% in 2008……No, we are not suggesting that today’s environment is comparable to the Great Financial Crisis. The point is simply that earnings expectations are not fixed.
There are several potential catalysts that could derail this earnings cycle: trade policy and tariff uncertainty, geopolitical developments…particularly anything that causes another sustained increase in oil prices…and increasing pressure on the consumer. If energy prices remain elevated…the consumer could face further cracks…creating a difficult feedback loop for corporate earnings.
So, our view is straightforward: the earnings revision cycle has been spectacular…but its composition deserves very close attention. A significant portion of the improvement is concentrated in commodities and technology…while important parts of the economy are seeing estimates deteriorate. (Let’s face it, higher commodity earnings are certainly positive for those companies…but they are not necessarily positive for the broader economy or the all-important consumer.)
For now, the earnings numbers are spectacular, and if they continue to come through at these levels, they will clearly provide an important bullish catalyst for stocks. However, with estimates having risen so dramatically…and with some investors even describing portions of the forecast as approaching bubble territory…we believe the third-quarter earnings season will be critical……As long as these expectations continue to be met or exceeded, the earnings cycle can continue to support the market. But if the environment changes, those elevated expectations could become a significant source of risk…….Which is a long-winded way of saying that the upcoming earnings season will be extremely important once again…and the expectations will need to be exceeded in a meaningful way.
---2) Technology Stocks…Can They Break Out?........Technology has rallied strongly, but the key question is whether the move represents the beginning of a sustained advance or simply another rally within a long trading range. The SOX, XLK and major technology ETFs need decisive breakouts above their prior highs to confirm a broader advance, while individual stocks such as PLTR are showing improving technicals and GOOGL remains a concern; the technology group could either drive the next leg higher or become a major headwind.
As we move into the fourth quarter…and after last week’s positive action…we believe the technology sector is approaching a critical juncture. Since the tech sector remains (by far) the most important one in the stock market, this “critical juncture” is not only for technology itself…but for the broader stock market.
Technology has enjoyed a very nice rally over the past week…helped in large part by the introduction of Meta’s Muse AI agent. The enthusiasm surrounding Muse helped lift virtually every major group within technology…and several areas moved back toward their all-time highs. The question now is whether this is the beginning of another sustained leg higher…or simply another rally within what has largely been a sideways market.
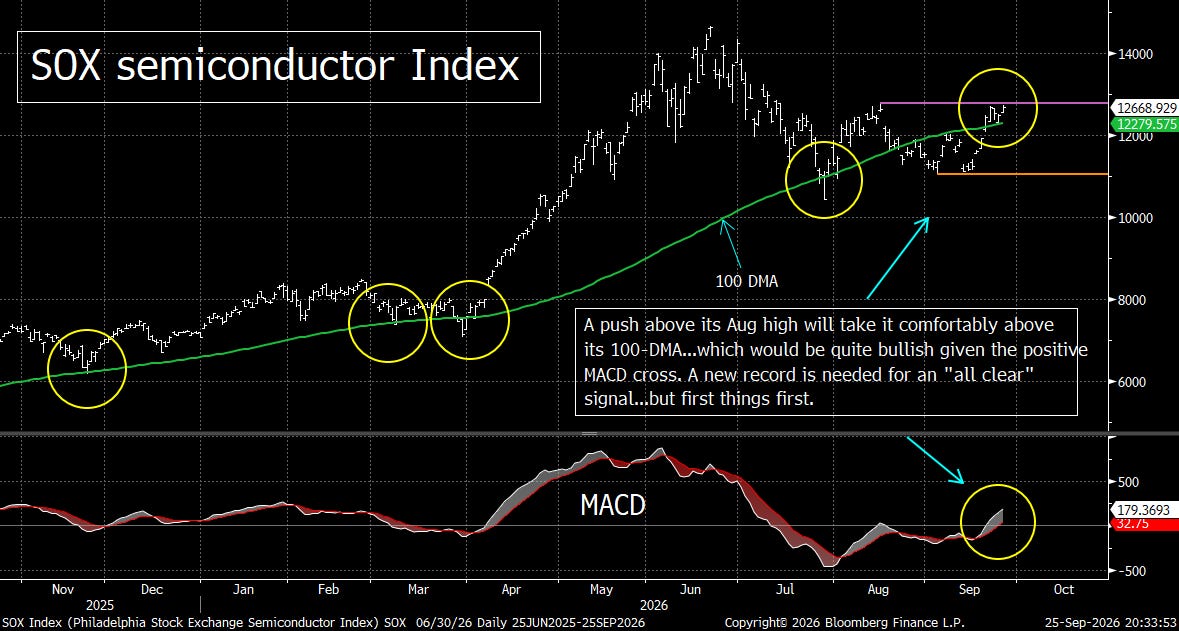
Our view is that we need to see considerably more upside follow-through before we can conclude that a durable new advance is underway. The semiconductor stocks are particularly important because they remain the key area of weakness within technology. The SOX semiconductor Index rallied nicely last week…which helped it move back above its 100-day moving average…and generated a positive MACD cross. However, it is still trading below its August highs…and remains meaningfully behind both the S&P 500 and several other technology groups…..A break above the August high near 12,800 would be an important short-term bullish signal. Ultimately, however, the semiconductors will need to break decisively above their June all-time highs to signal that a much larger advance is developing. (First chart below.)
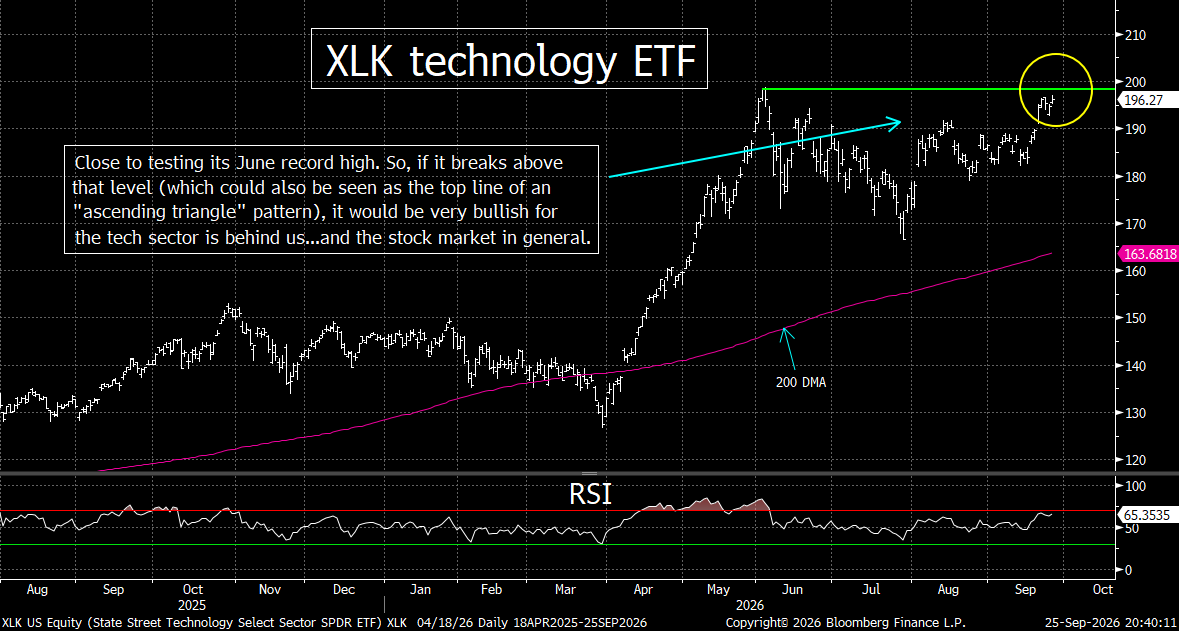
The XLK technology ETF is also at a critical point. It has moved close to its all-time high near 198…and a meaningful break above 200 would be particularly constructive. Conversely, failure at this level could create a double-top pattern and reinforce the idea that technology remains trapped in its broader trading range……Given technology’s enormous influence on the S&P 500…what happens next for the XLK could have significant implications for the entire market. (Second chart below.)
We also continue to watch Meta’s Muse story closely. We view Muse as a genuine product breakthrough…with extraordinary early adoption potential…but we believe the meaningful financial contribution is more likely a 2027–2028 story at the earliest. The bullish case is based on Meta’s enormous distribution, multiple potential monetization avenues, and the possibility that its massive capital expenditures ultimately become revenue-generating assets rather than simply costs. The risks are equally important: near-term free-cash-flow pressure, competition, and platform gatekeeping from companies such as Amazon…as well as privacy concerns, and the possibility that monetization continues to be pushed further into the future…are all issues which leave the level of uncertainty quite high.
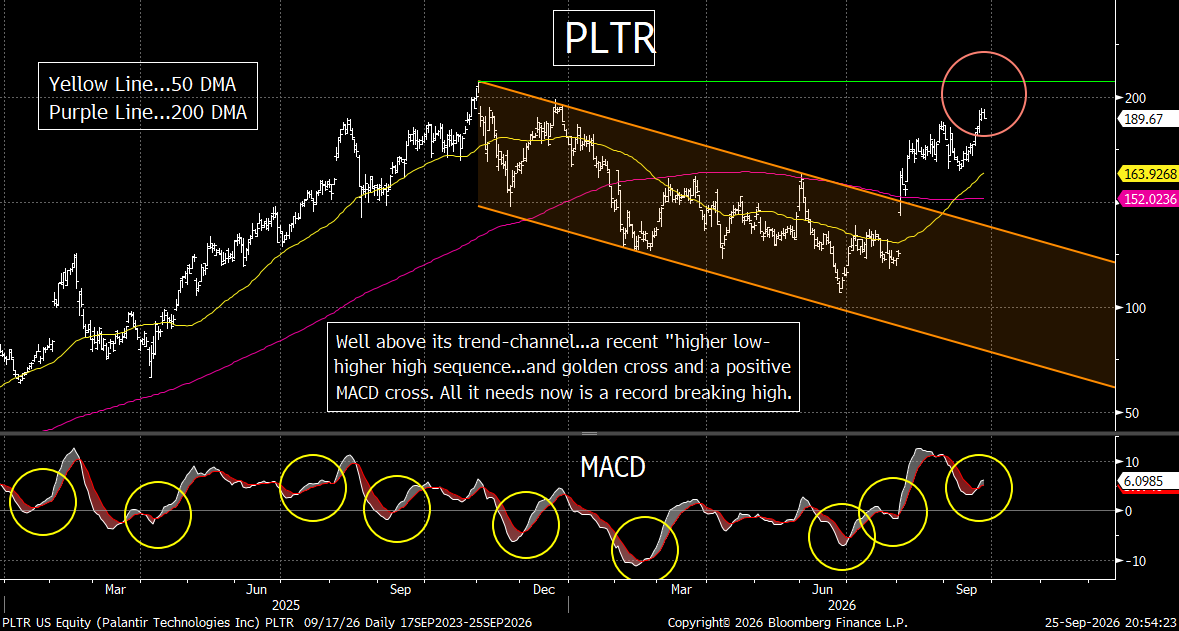
As we keep an eye on the key tech ETF’s, we’ll also be watching some individual stocks as well. On the bullish side, Palantir (PLTR) remains particularly encouraging. It has broken above its downward-sloping trend channel, reclaimed its 200-day moving average and generated a positive MACD cross. So, a move above its $208 all-time high would provide an important confirmation that its advance is becoming more powerful. (Third chart below.)
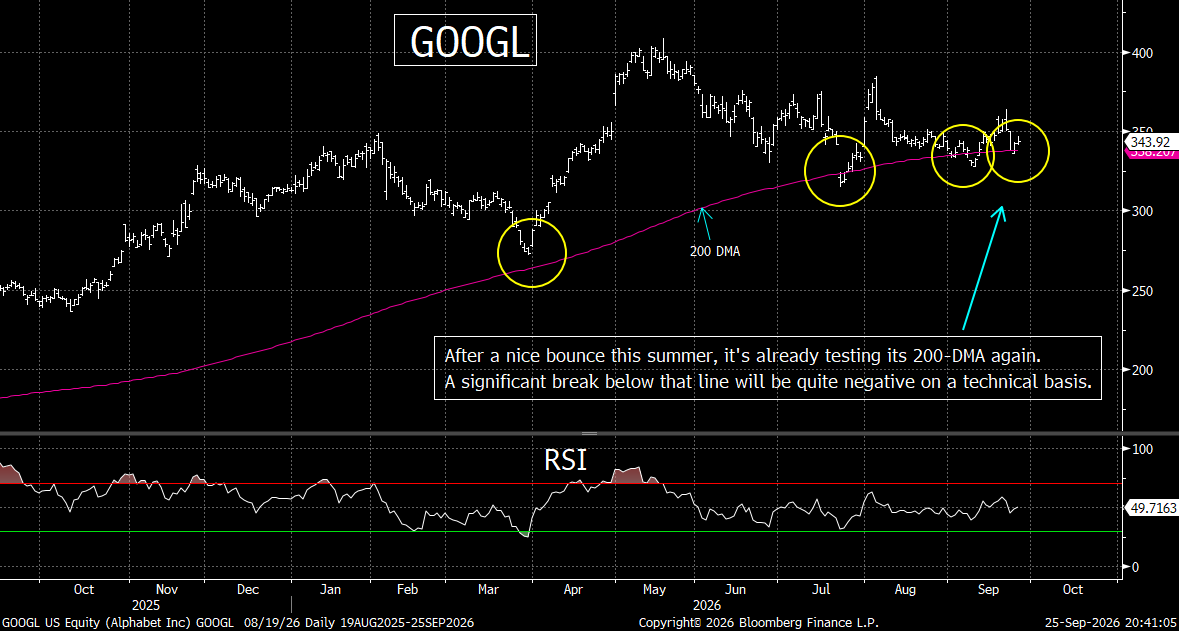
Alphabet (GOOGL), however, is a stock we are watching with considerably more caution. It has made another lower high…and has struggled to generate upside momentum…and is testing its 200-day moving average for the fourth time. A strong bounce would be constructive…but a meaningful break below that support would be a major warning flag. (Fourth chart below.)
GOOGL is widely viewed as one of the potential long-term winners of the AI race, so significant weakness would raise broader questions about the sustainability of the AI investment cycle. The fact that Amazon was a dominant beneficiary of the original Internet boom did not prevent its stock from falling dramatically when that bubble burst. In the same way, even a company with enormous long-term AI potential would not necessarily be immune if the AI investment cycle begins to deflate.
Therefore, as we enter the fourth quarter, technology remains one of the most important areas for us to watch. If semiconductors, XLK, (and the MAGS Mag 7 ETF) can break decisively higher…it would provide important confirmation that the market’s advance can continue. However, if these rallies fail again…and they roll-over… tech could become a significant headwind for the broader market. There will be plenty of key tech names to follow, but we believe that PLTR and GOOGL are ones which should be watched particularly closely.
---3) Our view on longer-term interest rates is pretty straightforward. Although we could see a near-term rally in bonds (drop in yields), we would not confuse this with the end of the multi-month rise in those yields. We also do not see this as a reason to be bullish on the stock market. In other words, even though there are signs that the US economy is improving, that is far from the only reason for the significant move higher in yields this year. The other issues are very important…and we believe they will keep yields elevated for the time being.
We want to touch on the near-term outlook for the Treasury market first, however. It has become quite oversold…and sentiment is deeply depressed. In fact, futures traders are showing bullishness of only about 10%...and an 18-day average of just 14% bullishness! This is extreme…and when you have that many investors positioned on one side of the boat, it creates the conditions for a material contrarian move. So yes, we could see bond prices bounce and long-term yields come down before long…but we would view that as a trading opportunity…not necessarily the beginning of a sustainable decline in rates.
Why? Because there is much more going on here than simply a stronger economy……We readily acknowledge that the economic data have improved. The Citi Economic Surprise Index has surged from roughly 15 to 46 over the past two months. That tells us the economy has been outperforming expectations. However, inflation is also proving to be more persistent than investors had hoped…with both CPI and PPI recently coming in hotter than expected.
And then there is the Federal Reserve……This is where we think the stock market may be underestimating the risk. Since the Fed’s rate increase, the message coming from Fed officials has been decidedly hawkish. Michael Barr, Anna Paulson, Thomas Barkin, Beth Hammack and Susan Collins…have all emphasized the need to remain aggressive in fighting inflation. Also, Austan Goolsby has gone even further….saying that the economy may have to experience some pain before inflation gets back to the Fed’s 2% target.
That is not the language of a Fed that is preparing to quickly reverse course…and thus we believe it’s something that will negatively impact the equity market before too long. In fact, this is exactly how the spoke after they began their rate hiking cycle in 2022. So, we are becoming increasingly concerned that the market is still thinking in terms of a “one-and-done” rate hike. We think that is dangerous……If the Fed ultimately DOES stop after one additional hike…there is a good chance it will be because the economy has weakened materially. And if that is the reason, it certainly would not be a bullish development for stocks.
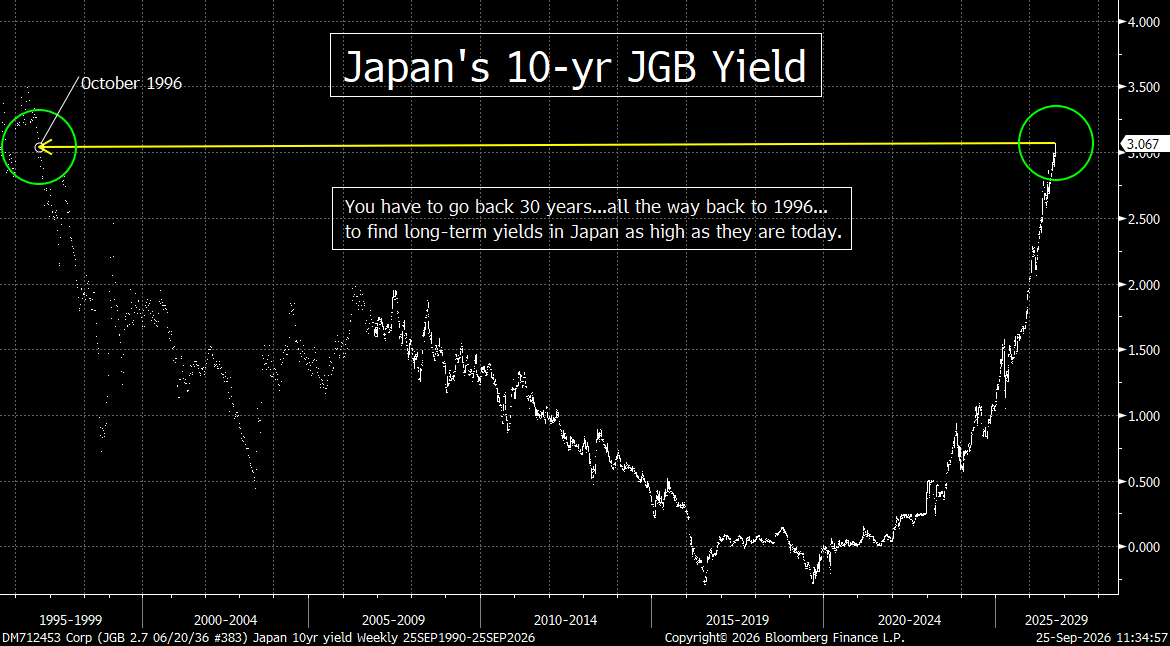
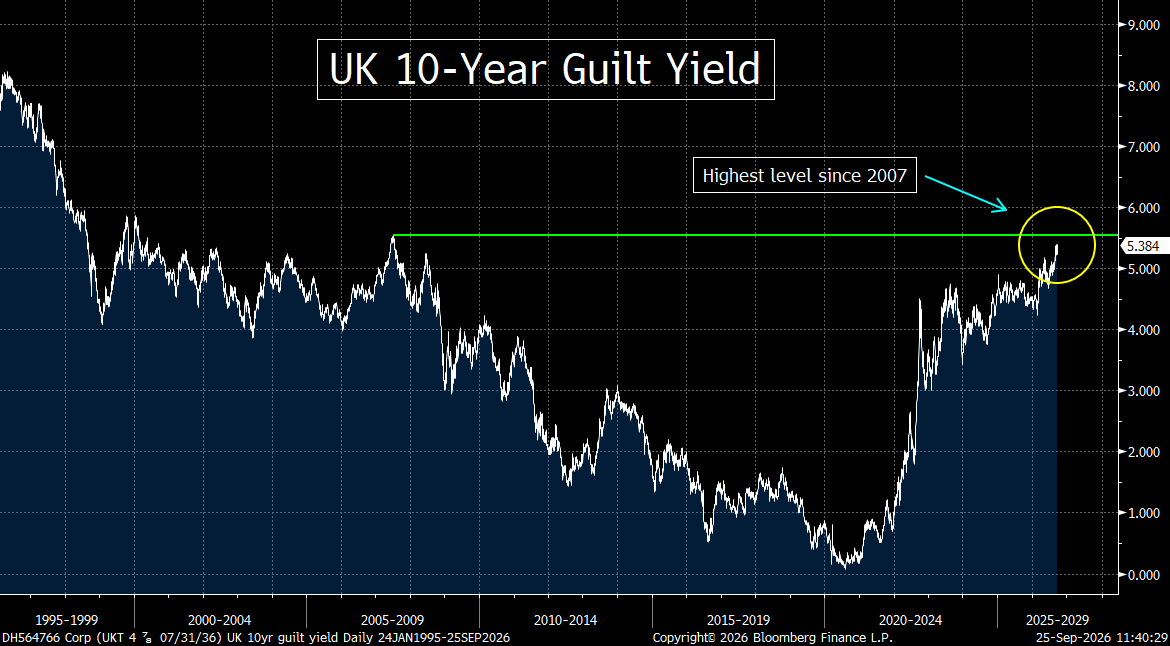
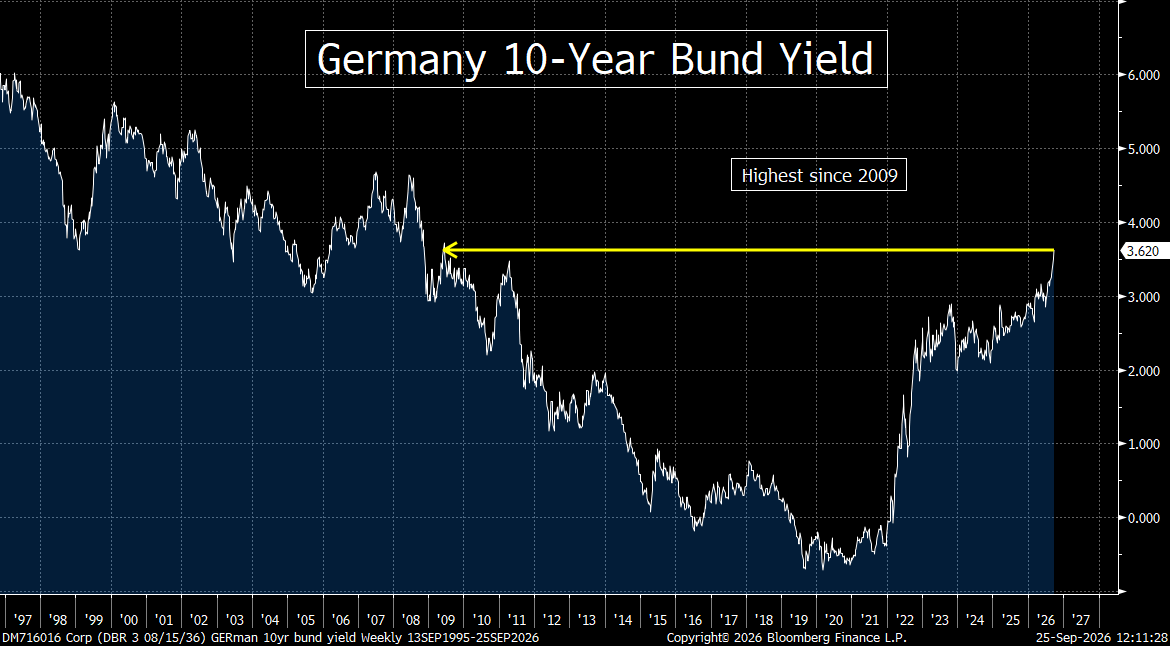
But perhaps the biggest issue is fiscal policy…..Investors around the world are demanding a higher risk premium because governments are running enormous and deteriorating budget deficits. More importantly, this is not just a U.S. problem. The 10-year Treasury is at its highest yield since 2007, while the 30-year Treasury is at its highest level in roughly three decades. Japan’s 10-year JGB has moved above 3%...its highest level since 1996. On top of this, the U.K. 10-year gilt is at its highest level since 2007…and the German 10-year Bund is at its highest level since 2009. So, you can see that this is a global phenomenon. These are not countries that are seeing outsized growth at all…and in the case of France, things are slowing materially.
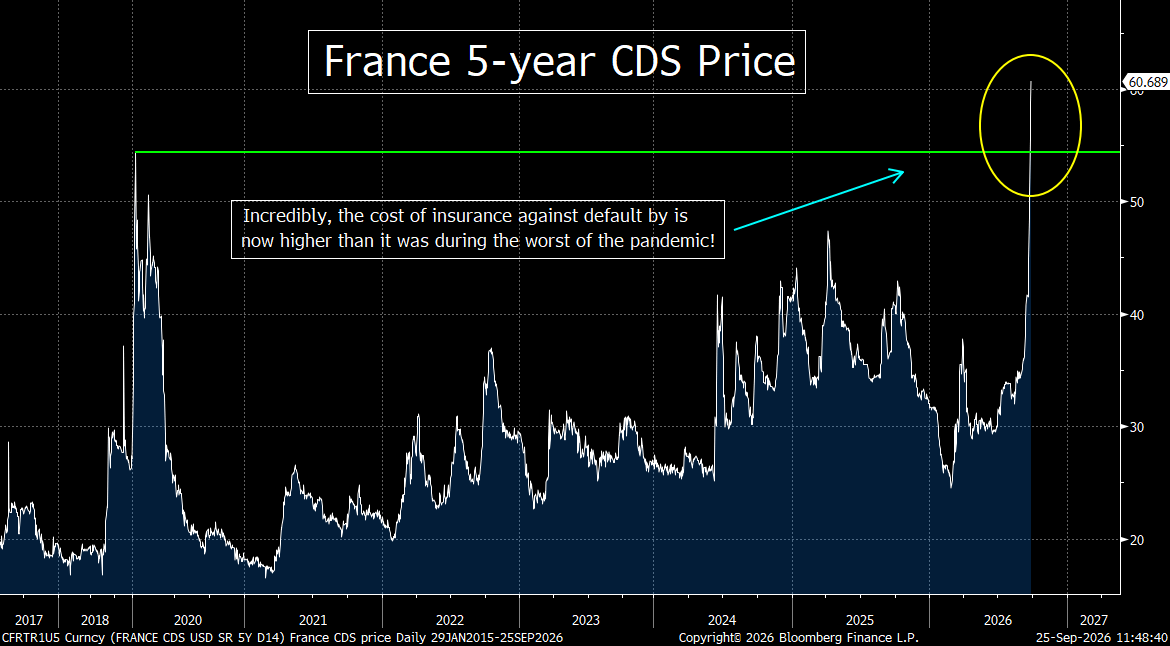
Speaking of France, the fiscal situation is becoming increasingly serious. The country has failed to get its deficit below the EU’s 3% threshold since 2018, recently abandoned its 2026 deficit target…and its CDS prices have risen to levels not seen in more than a decade!
Therefore, we believe the bond market is telling us something important. This is not simply a story about stronger economic growth. It is about inflation, Fed policy, massive government borrowing and investors demanding to be paid more for taking on that risk……Could long-term rates fall in the short run? Absolutely. In fact, given how oversold the bond market has become, we would not be surprised to see it happen.
However, unless we see a significant slowdown in growth over the next three to six months, we believe the risks remain skewed toward structurally higher long-term yields…and that matters enormously for stocks……History is very clear: when long-term interest rates rise sharply and stay there, the equity market eventually pays the price. The old saying is, “Don’t fight the Fed.” Right now, we would add another warning: don’t fight the bond market either.
---4) Rising Rates + Rising Oil Prices…….History shows that periods when long-term interest rates and oil prices rise sharply together have often been followed by significant equity-market declines…even when stocks initially absorb those pressures without much difficulty. The current resilience therefore should not create complacency…particularly with diesel prices also rising; the concern is that higher financing and energy costs eventually begin to pressure consumers, corporate earnings and economic activity.
One of the most important arguments we have made repeatedly this year is that investors should not become overly complacent simply because the stock market has been able to absorb a significant rise in long-term interest rates and oil prices without suffering a major decline…at least so far. History tells us that this type of resilience is not unusual. In fact, the stock market has repeatedly been able to “shake off” these pressures initially. The problem is that, eventually, it has not been able to do so forever. Eventually, these issues always have a negative impact on stocks.
This is something we’ve been talking about quite a bit over the last month or more…but we think this is a good point in this weekend’s piece to reiterate the history behind these moves. (It’s also…finally…something that others on the Street are beginning to talk about.)
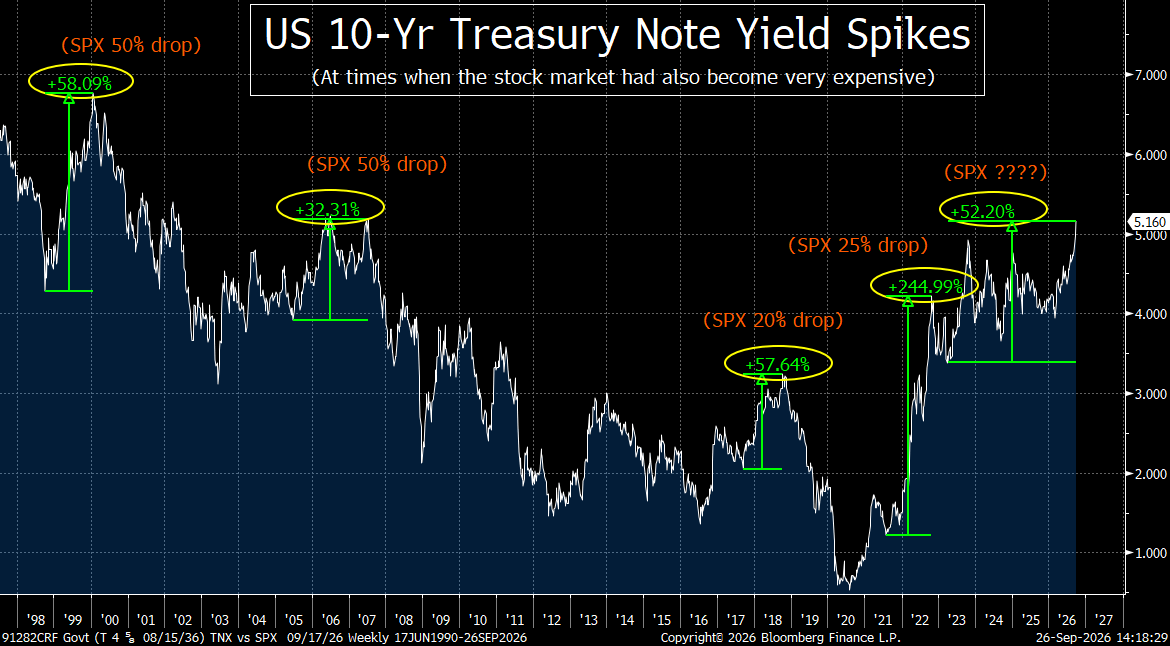
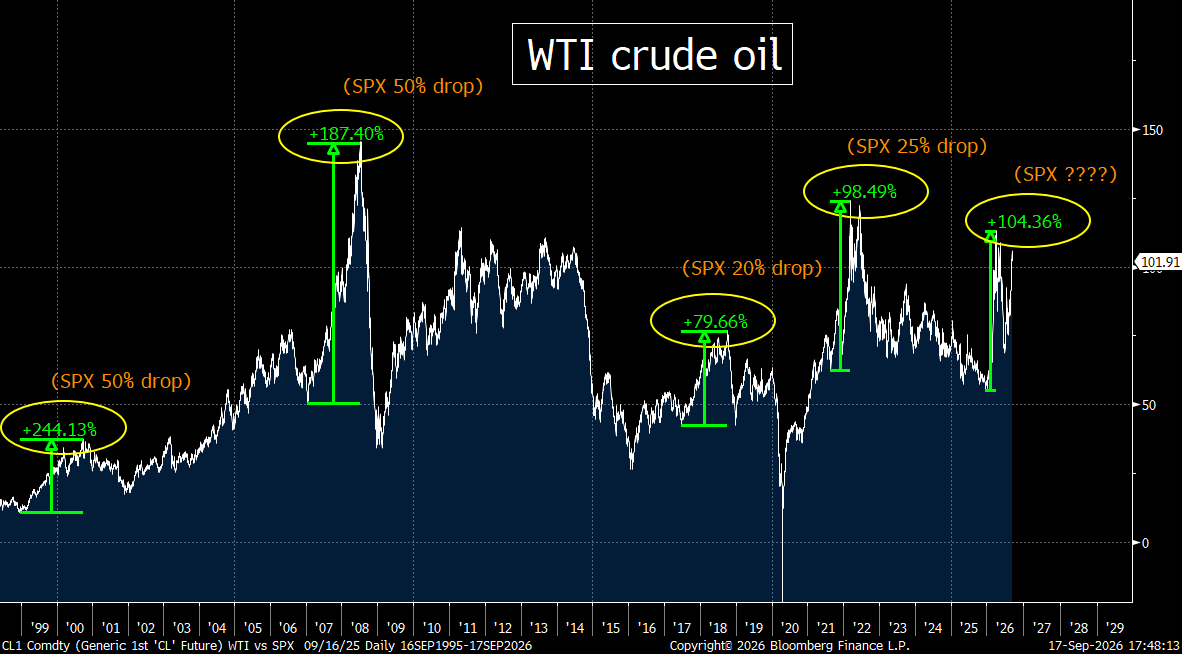
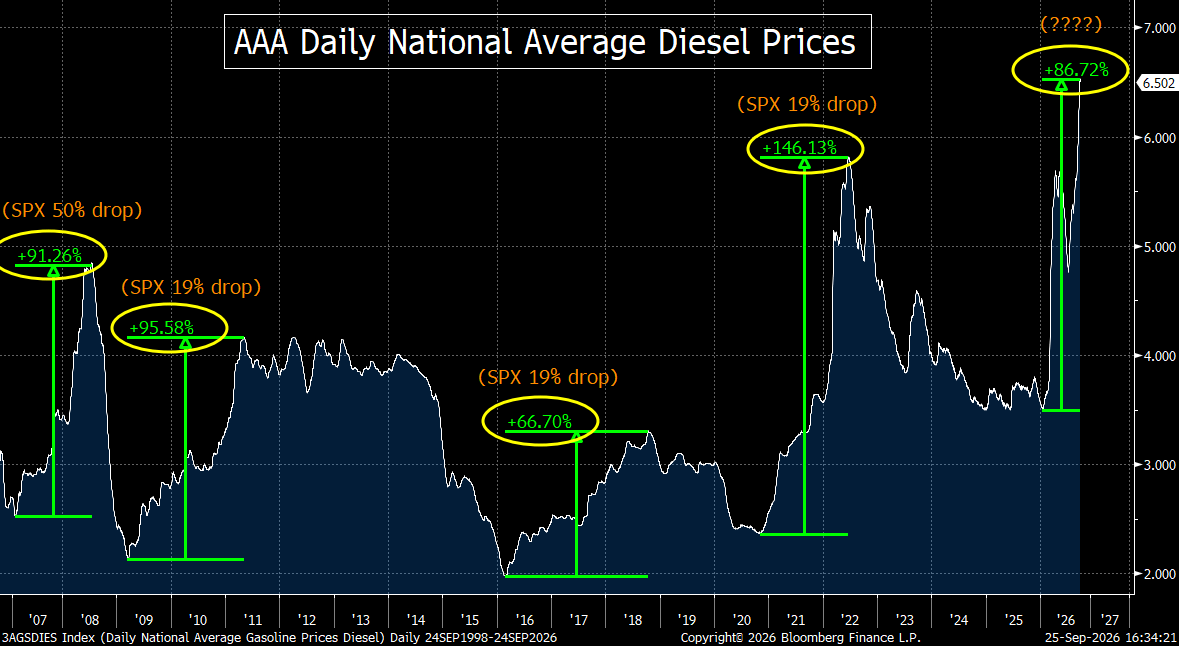
Over the past 40 years, there have been several important periods—including 1987, 2000, 2007, 2011, 2018, 2020 and 2022…when a significant rise in long-term interest rates occurred alongside a meaningful increase in oil prices. In every one of those instances, the S&P 500 subsequently experienced a substantial decline…ranging from roughly 19% to 50%. The historical pattern is remarkably consistent: higher borrowing costs and higher energy costs eventually become a meaningful headwind for corporate earnings, consumers and economic activity…not to mention the competition those higher guaranteed rates give the stock market
The relationship between rates and oil is also important because the two can reinforce one another. Higher oil prices can intensify inflationary pressures…making it more difficult for interest rates to decline…while higher rates can increase the economic burden created by expensive energy. This does not mean that every increase in rates or oil prices automatically produces a bear market. However, when both move sharply higher over a relatively short period, history suggests that investors should take the combination very seriously.
That is why we are not particularly reassured by the market’s ability to absorb these moves today. The argument that “the market has already shrugged it off”…or “has already price it in” misses the historical lesson. The market has almost always shrugged it off initially. It is what happens later that has mattered.
We have previously shown charts demonstrating the relationship between major increases in long-term interest rates, oil prices and subsequent weakness in the S&P 500…and we have reproduced those charts below……We have now added a third chart examining diesel prices over the past two decades. (Third chart below.) This is particularly relevant because diesel remains critical to the transportation of goods and people throughout the global economy. Transportation companies may not represent as large a share of the economy as they did decades ago…but the cost of moving goods remains an important economic variable. A sharp rise in diesel prices therefore creates another potential source of pressure on businesses and consumers.
Our point is not that the market must decline immediately. It is that investors should not mistake short-term resilience for evidence that the historical relationship has disappeared. The stock market has repeatedly demonstrated an ability to ignore rising rates and energy prices…until it doesn’t. And historically, when that reversal has occurred, it has not been a minor adjustment. It has often been a very significant decline……That is why we believe these trends deserve considerably more attention than they are receiving today.
---5) The key message we wanted to convey in the past few points is that the stress in the fixed-income markets is much broader than simply higher Treasury yields. It is not just the 10-year Treasury that is under pressure; even shorter maturities…including the two-year note…are moving toward 5%. More importantly, however, a number of indicators across the fixed-income landscape are beginning to flash warning signs that are not yet being reflected in traditional credit spreads.
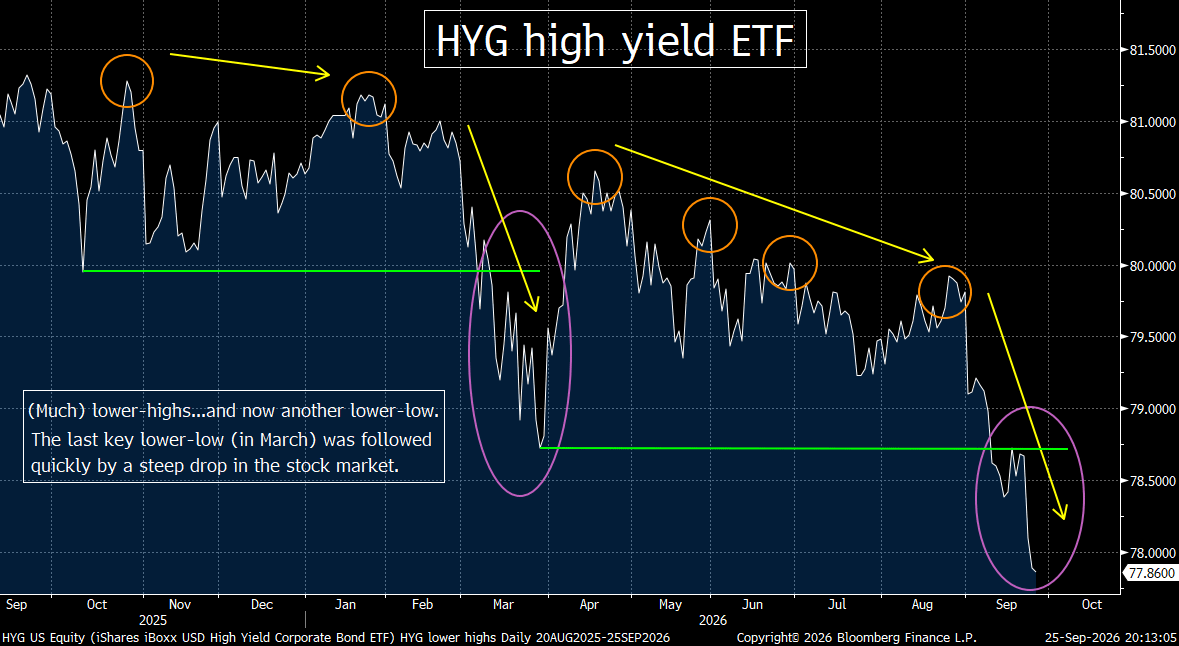
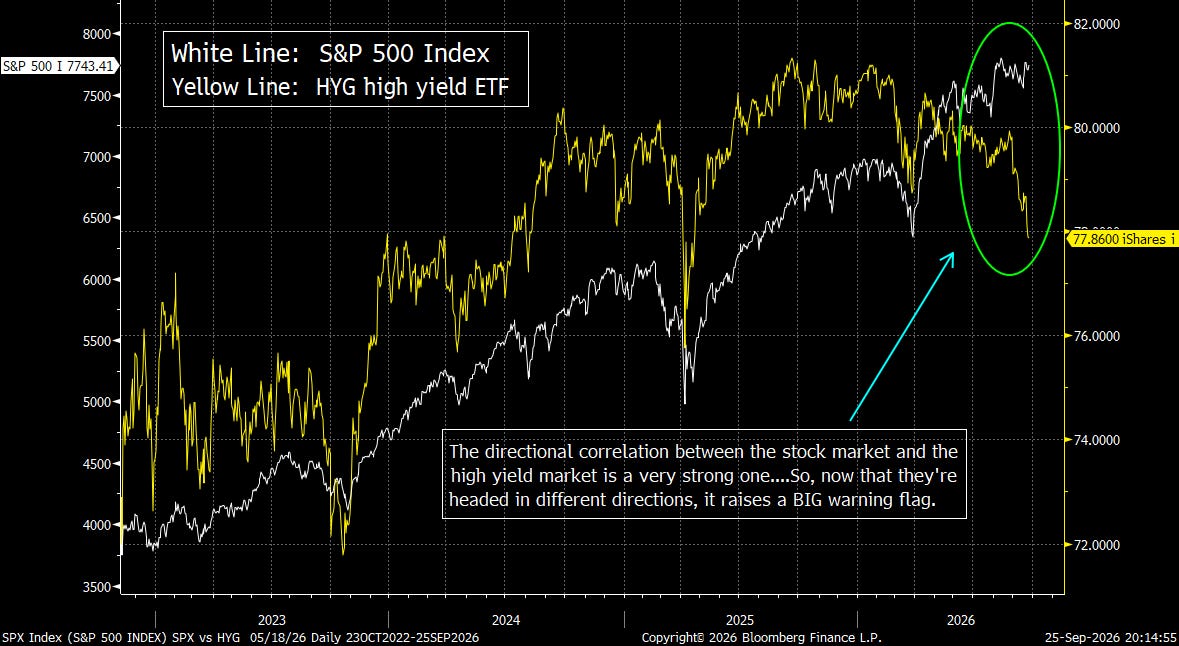
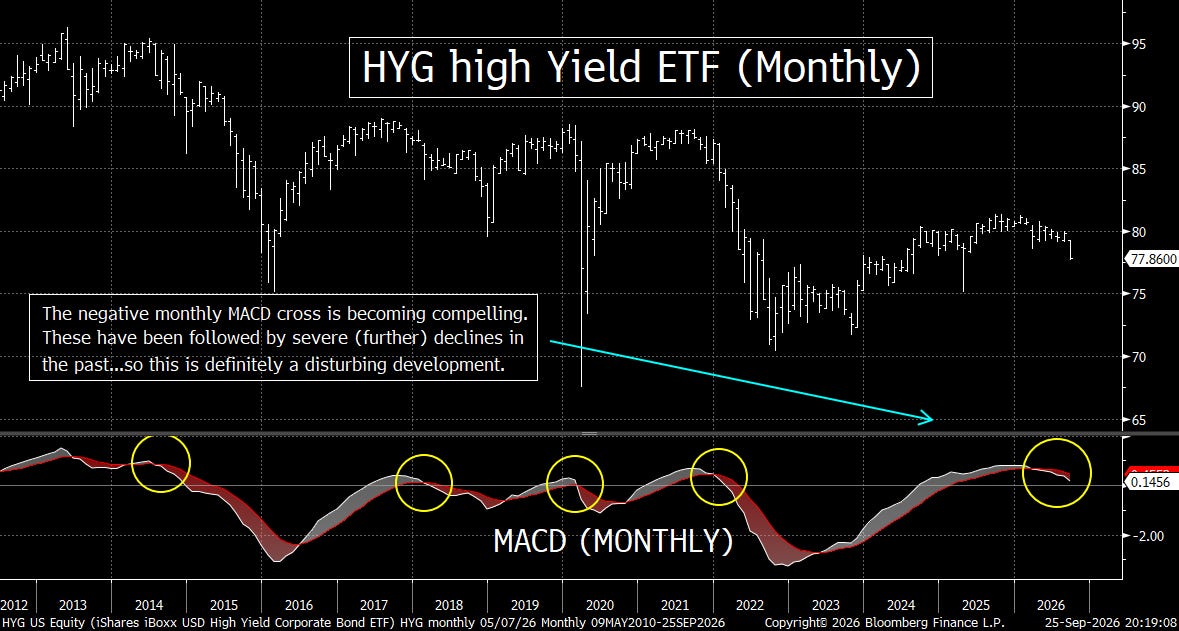
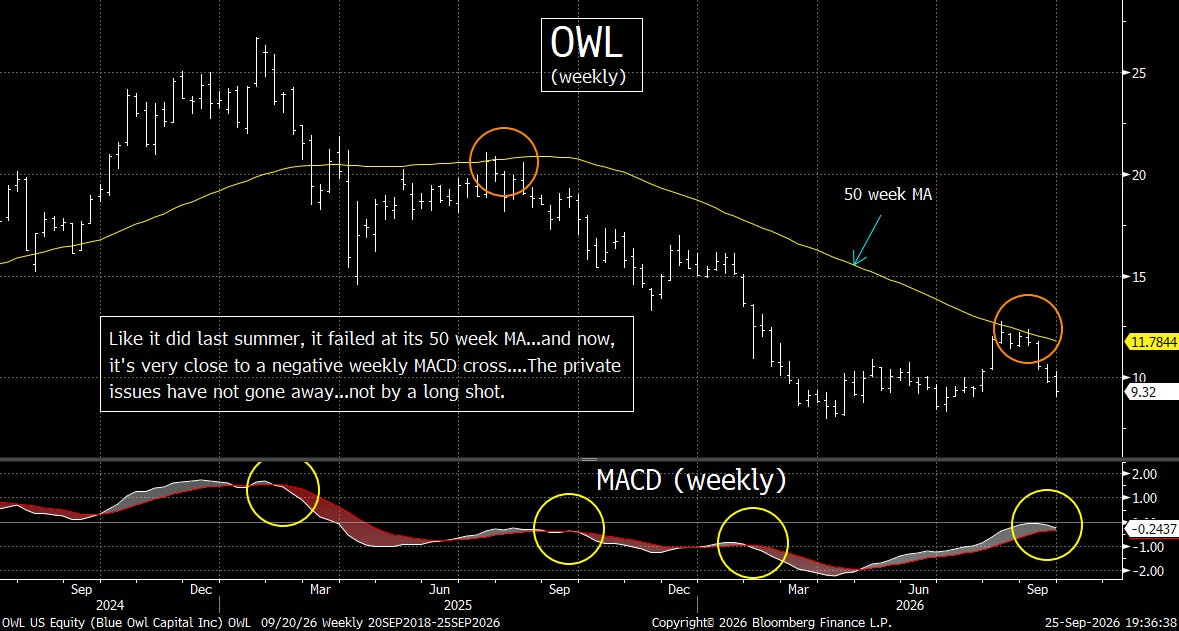
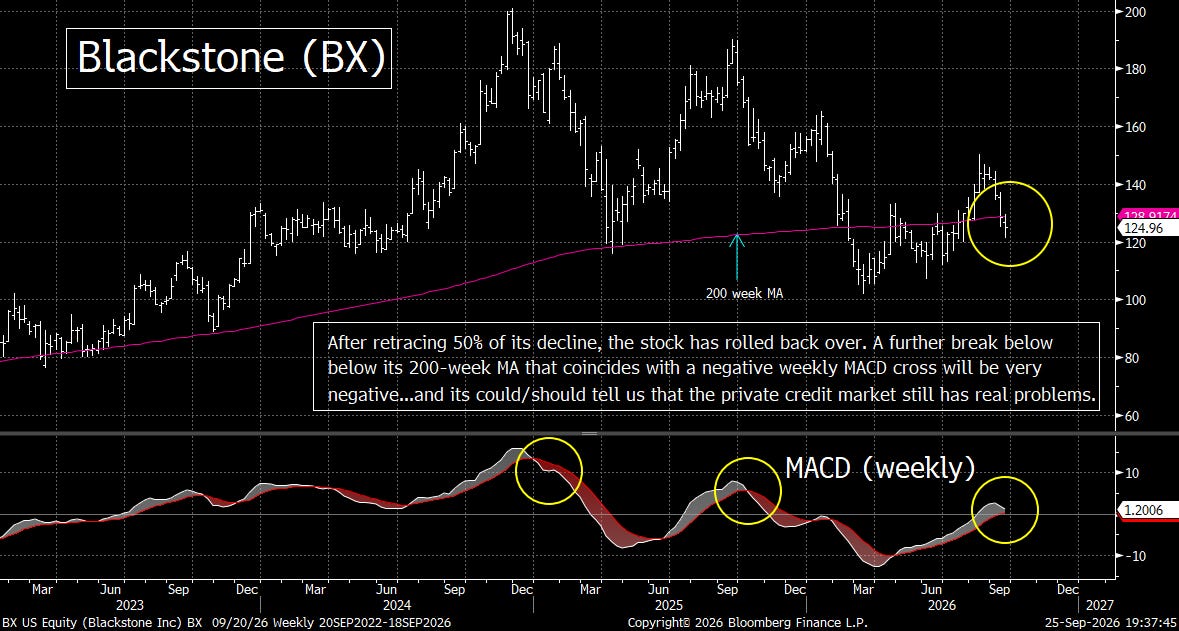
As we have emphasized before, credit spreads tend to remain remarkably tight…until a credit problem has already become serious. That is why we believe the charts we have provided below are particularly important: they provide a clearer picture of the underlying stress. (A picture is worth a thousand words.)…..With this in mind, we have updated several charts from recent weeks…to explain what we mean.
The high-yield market, for example, has been diverging from equities for roughly a year…making a series of lower highs and, more recently, a significant lower low. HYG has also declined sharply…creating an increasingly important divergence with the stock market. Most notably, its monthly MACD is now approaching a potentially significant negative crossover…a development that, when it has occurred in the past, has often preceded substantial additional weakness in high yield.
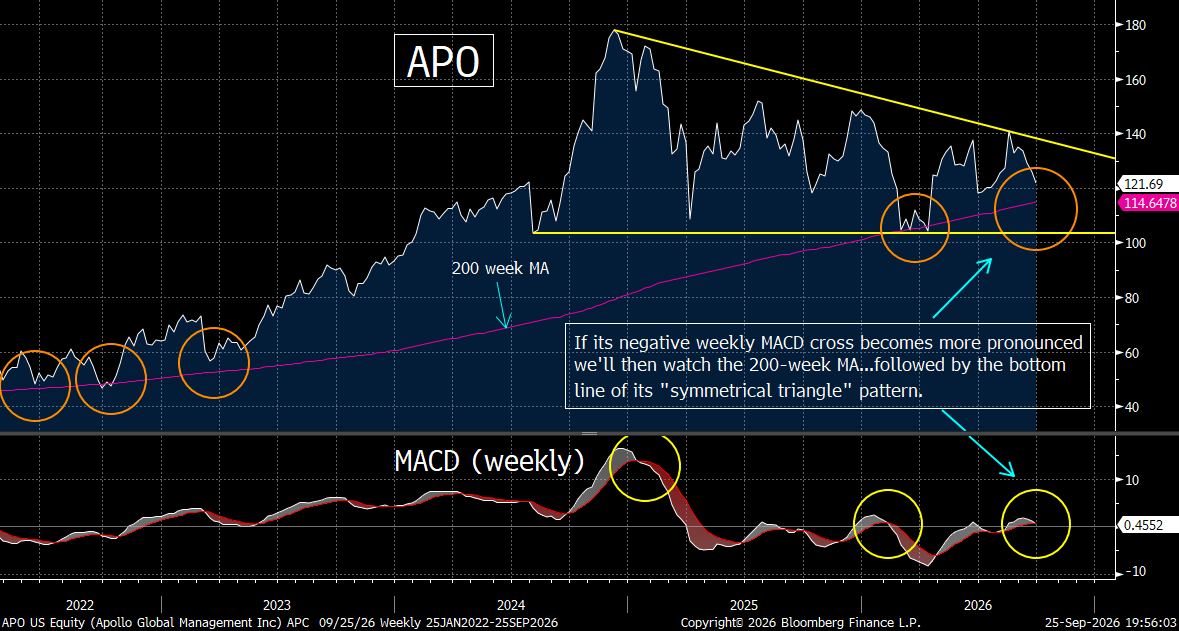
The same concerns extend to private credit. Despite repeated assurances that conditions are stabilizing…we continue to see restrictions or closures of withdrawals from private-credit funds…while the stocks of major private-credit firms are showing meaningful technical deterioration. Blue Owl (OWL) has rolled over sharply from its 50-week MA…and is approaching a negative MACD cross……Also, Blackstone (BX) has fallen below its 200-week MA…and is nearing a similar negative weekly MACD signal…while Apollo (APO) has formed a descending triangle…and is approaching a potentially important negative MACD cross.
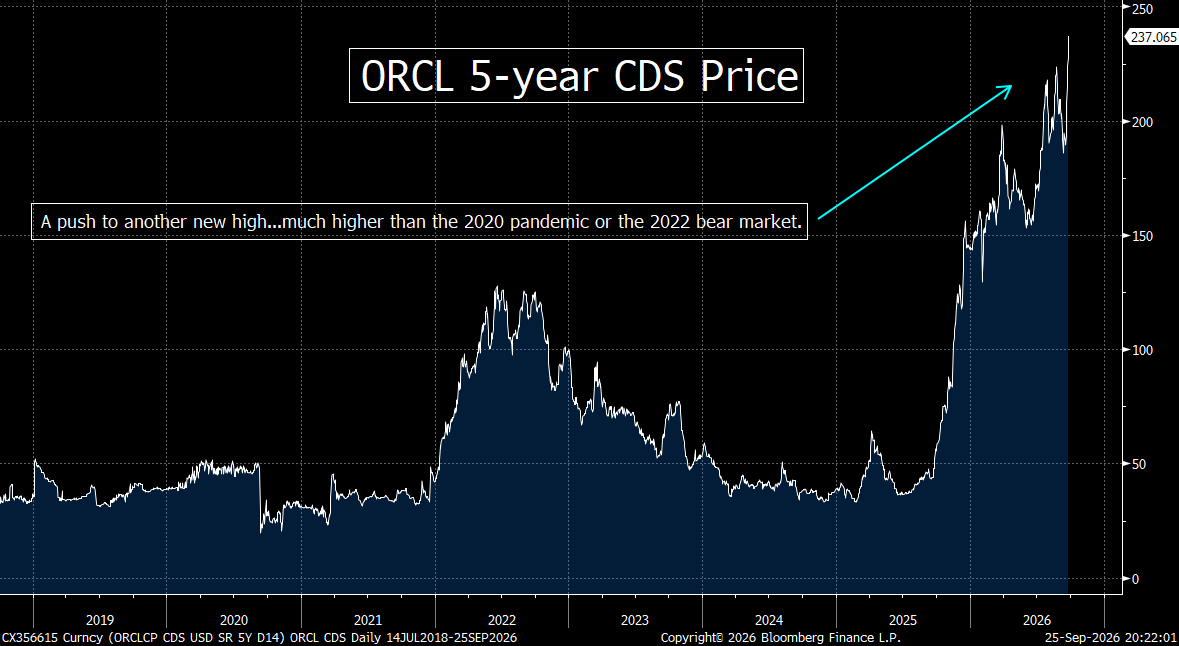
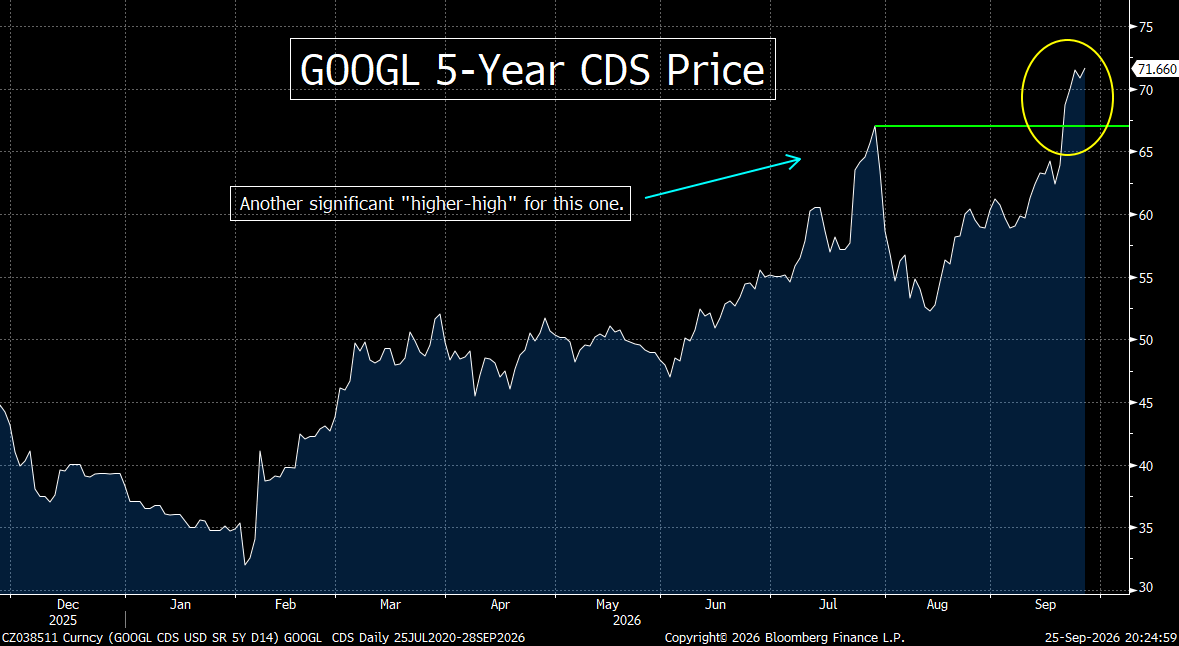
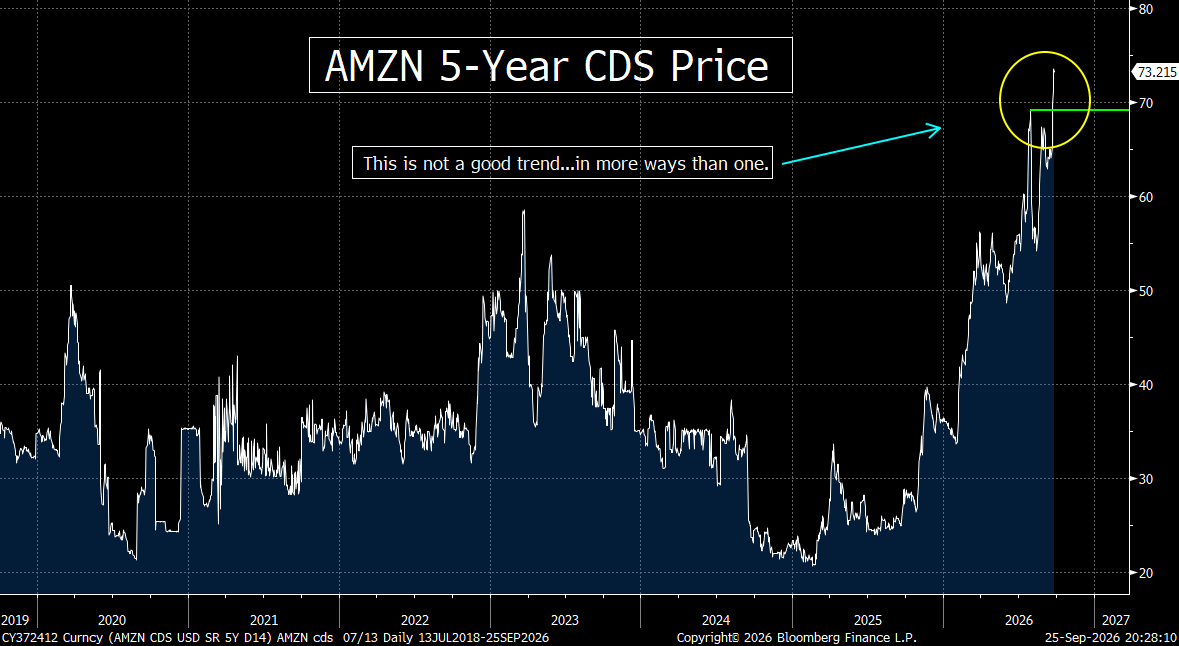
There are also warning signs within the credit markets surrounding the hyperscalers. We continue to believe that the hyperscalers could ultimately be an important catalyst for another leg higher in equities. HOWEVER, the behavior of their CDS prices is raising questions. Credit-market pricing is becoming less comfortable even as companies such as Oracle (ORCL, Alphabet (GOOGL) and Amazon (AMZN) are seeing their CDS prices make substantially higher highs. This divergence raises legitimate questions about the enormous amounts these companies are spending on AI infrastructure and…the debt they’re raising to fund this spending…and ultimately, the return they will earn on that investment.
The bottom line is that the fixed-income market is exhibiting considerably more stress than headline credit spreads suggest. None of these indicators, by themselves, guarantees a broad stock market decline. However, taken together, they suggest that investors should be paying much closer attention to ALL of the credit markets…because they may be signaling problems well before those problems become obvious in traditional measures of credit risk.
---6) Major Index Charts…..The major averages have essentially gone nowhere on a net basis for roughly six weeks…leaving the S&P 500, Nasdaq 100 and Russell 2000 at important technical crossroads. The Nasdaq has improved significantly and could become very bullish if it decisively clears its prior highs…while the S&P needs to break out despite a negative weekly MACD signa…and the Russell 2000 is showing greater deterioration……In short, the bulls need to deliver a meaningful breakout soon.
The stock market has been remarkably quiet on a net basis. The S&P 500 and Nasdaq 100 are almost exactly where they were six weeks ago…and both have essentially been moving sideways for the past three to four months. Thus, even though they are close to new highs, the net moves have not been important recently……..The Russell 2000 has followed a similar pattern…although it did outperform during the summer…and is now beginning to underperform again.
That lack of movement is about to become much more important because all three major averages are approaching critical technical levels.
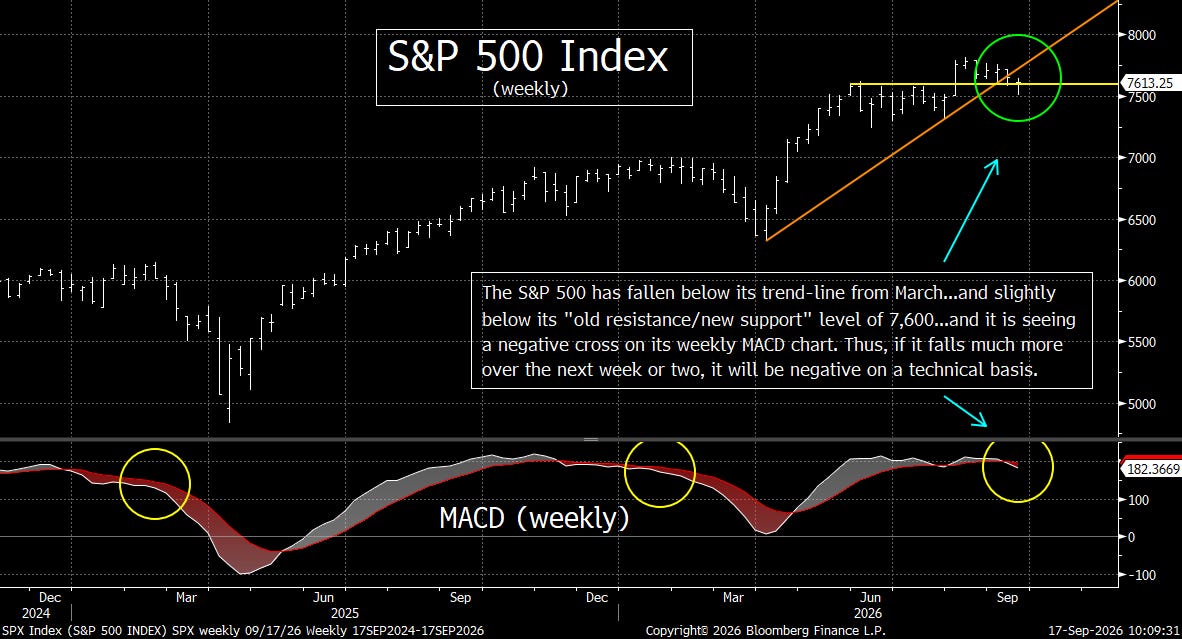
Let’s start with the S&P 500. It remains just below its all-time high and, despite last week’s gain, it is still below the trend line that goes back to March. More importantly, the weekly MACD has recently generated a negative cross. That deserves attention because the last two times we saw this same signal, the stock market subsequently suffered outsized declines. It does not mean another decline is inevitable by any means, but it tells us that the S&P cannot afford to stumble here. It needs to move higher…and it needs to do it soon. That said, if it CAN move higher…and take out it’s all-time high in any significant way…it will be very bullish……So, you can see, the SPX does indeed stand at a critical juncture. (First chart below.)
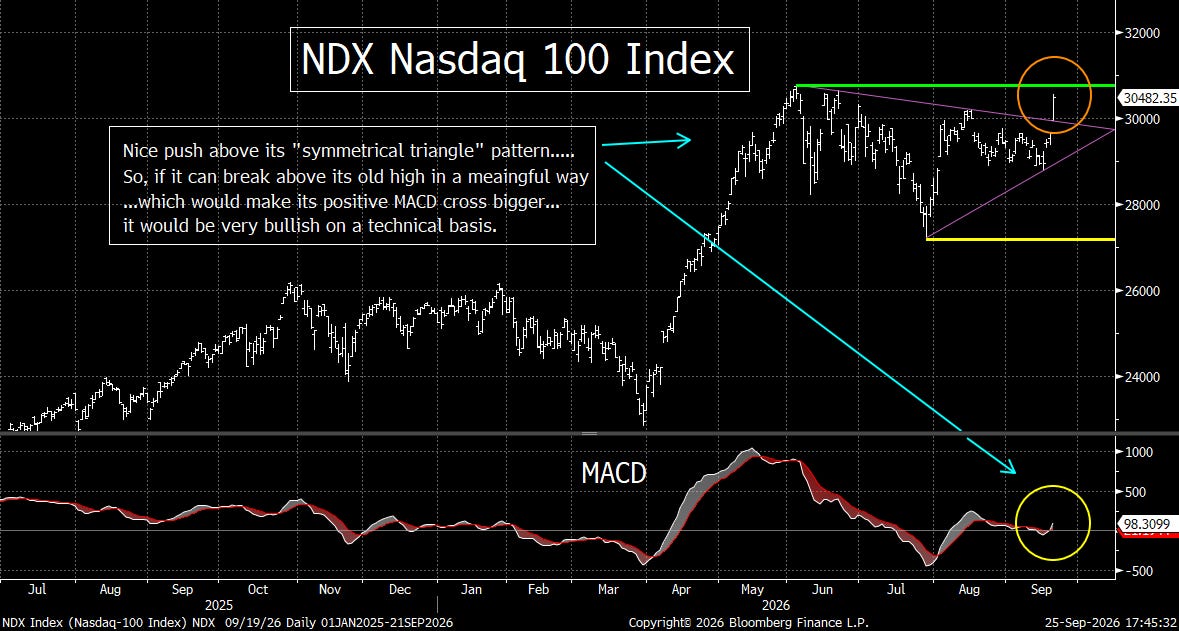
The Nasdaq 100 is in better shape. It had a very strong rally last week…broke out of its symmetrical triangle pattern…and generated a positive weekly MACD crossover. This tech-heavy index was helped by renewed enthusiasm surrounding Meta’s Muse AI product…and that strength spread across much of the technology complex…..There is, however, still one hurdle that matters: the NDX has not broken above its old highs in a meaningful way yet. If it can…it will be VERY bullish. However, until it decisively clears those highs, we have an improved chart…not a confirmed breakout. (Second chart below.)
And that distinction is extremely important. If the Nasdaq can push above those highs and hold the breakout…it could unleash a significant amount of upside momentum……Given how close the S&P and Nasdaq already are to their all-time highs, a breakout in both would be a very powerful technical development.
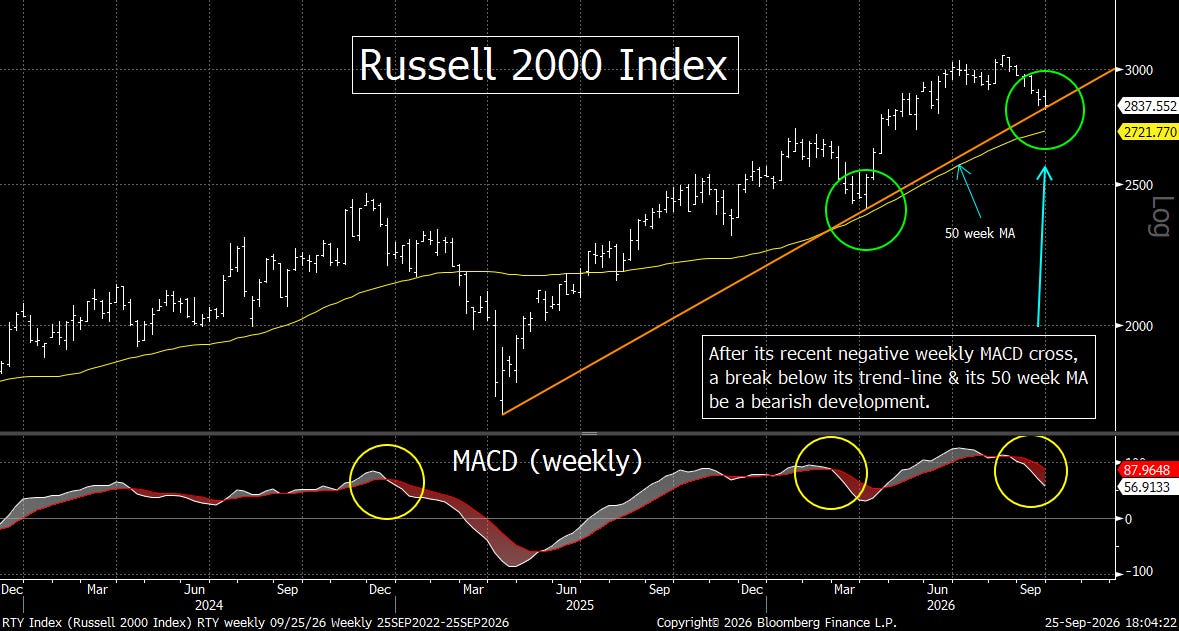
The Russell 2000, however, is sending a different message. It declined last week and is now testing its weekly trend line extending back to March 2025. It has also already experienced a negative weekly MACD cross. Thus, if that trend line breaks decisively, the technical deterioration in small caps could/should accelerate. (Third chart below.)
So, this is the message heading into next week: the market is at a technical crossroads. The S&P and Nasdaq are knocking on the door of new highs. vIf they break through, the resulting momentum could be substantial—and could finally produce the type of broad market rally the Trump administration has been hoping for.
That said, there is very little room for complacency. The S&P’s MACD warning…and the Russell’s weakening trend are telling us that the market has to prove itself. The next major move matters…and right now, the charts are saying that the bulls need to deliver. If not, the above-mentioned moves in several other asset classes could create a significant change in trend…very quickly.
---7) China’s economy continues to face structural challenges from the prolonged property downturn, weak consumer demand, deflationary pressures, demographic changes and excess capacity…while shifting trade dynamics add further uncertainty. The CSI 300 Index has essentially gone nowhere over the past year…and is now testing important support. Therefore, a decisive break below that level would represent a meaningful deterioration…and could have broader implications for global growth.
With all the attention surrounding the potential summit between President Trump and President Xi…there has been surprisingly little discussion about what is happening beneath the surface of the Chinese economy and its stock market. That is something we believe investors should not overlook. China’s economic trajectory over the past several years has been uneven, and while we still expect the economy to produce positive growth…that growth is likely to remain structurally slower for some time.
There are several reasons for this. The prolonged property downturn continues to weigh on household wealth and confidence…while subdued consumer spending and persistent deflationary pressures remain significant concerns. At the same time, shifting U.S.-China trade dynamics create another layer of uncertainty for Chinese manufacturers and exporters. Beyond these cyclical issues, China also faces important structural headwinds…ncluding an aging population and what is often referred to as “involution”…intense domestic competition and excess capacity that can undermine pricing power and corporate profit margins.
All of this matters for the stock market because slower growth…weaker consumer confidence…and excess capacity can constrain corporate profitability, capital investment, and consumption for years rather than merely a few quarters. Against that backdrop, it is not particularly surprising that China’s stock market has fallen roughly 12% over the past three to four months.
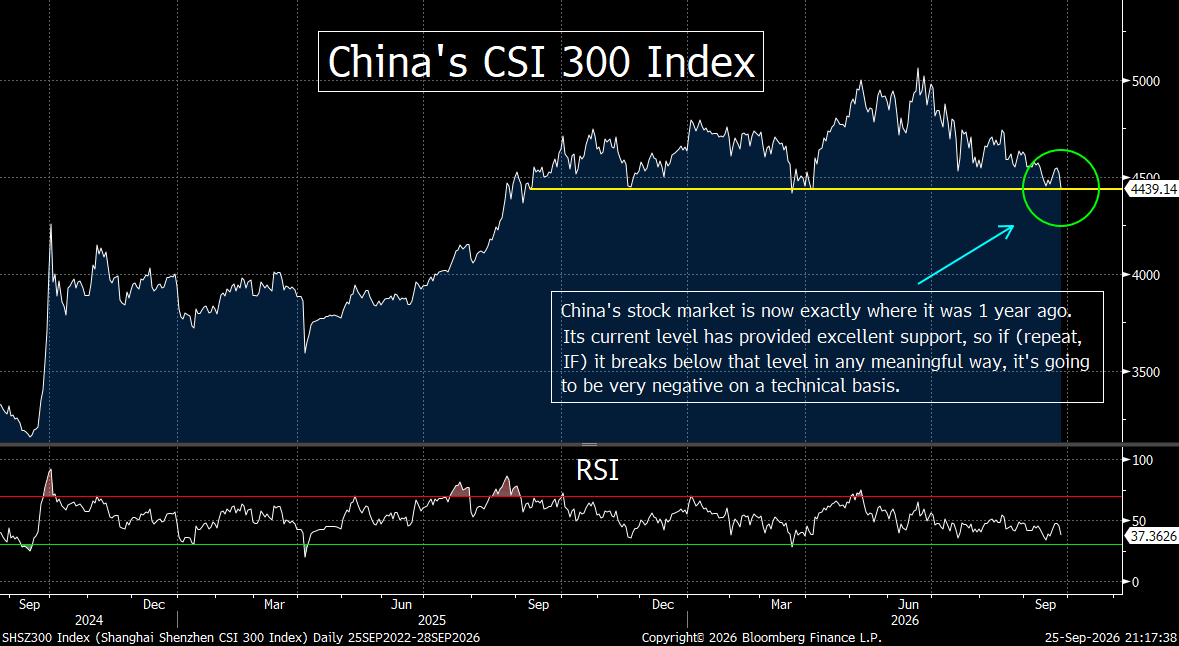
What is more concerning to us, however, is the technical picture. The CSI 300 Index currently stands almost exactly where it did 12 months ago…meaning that despite considerable volatility over the past year…investors have essentially gone nowhere. More importantly, after its recent decline…the index is now testing important support established by the lows from December of last year and again in March and April of this year.
That makes the current level particularly important. If the CSI 300 breaks decisively below this support, it would represent a meaningful technical deterioration…and could signal that the weakness in Chinese equities is becoming more than simply a consolidation. (Chart below.)
Our point is not that China is about to experience an economic collapse. Rather, we believe investors need to pay attention to the risks developing outside the United States. We remain focused very closely on the U.S. economy and markets…but we do not want that focus to cause us to miss important developments elsewhere. If global growth is already facing structural challenges, a meaningful slowdown in China would only add to those concerns…and could ultimately have important implications for the global economy and financial markets.
---8) Despite a cautious six-to-twelve-month market outlook, several individual stocks could benefit if a liquidity-driven…and momentum-driven rally…develops in the near term. AAPL remains in a strong uptrend…MSFT is attempting to break out of a multi-week consolidation…IONQ is breaking out of a symmetrical triangle…and BE has repeatedly found support at its 200-day moving average. Thus, any decisive moves above their respective resistance levels would strengthen these bullish technical setups.
Our overall view of the stock market remains cautious…particularly as we look out over the next six to twelve months. There are simply too many developments coming together that, historically, have often accompanied important market tops. Valuations remain elevated, the rally has been unusually narrow, interest rates have risen sharply…and oil prices have moved significantly higher. At the same time, we are seeing important divergences…particularly between the S&P 500 and the semiconductor stocks and between the S&P 500 and the high-yield market. On top of all this, we still have major questions surrounding the ultimate return on investment from the enormous amount of capital being committed to AI.
Taken together, these are not developments we want to ignore. In fact, when several of these conditions occur simultaneously…history tells us that the market can become increasingly vulnerable to a more significant correction.
That said, being cautious over the next six to twelve months does NOT mean we believe the market has to decline immediately. Quite the contrary. We can easily envision another near-term rally…particularly between now and the election. There is still considerable liquidity in the financial system…as reflected in the continued expansion of the Federal Reserve’s balance sheet. The administration also has a strong incentive to maintain favorable financial-market conditions into the election.
There is another potential catalyst that we cannot dismiss: a surprisingly positive development regarding the Middle East. A meaningful announcement concerning the war…even if it ultimately proves temporary…could produce a sharp relief rally in stocks…particularly if it causes oil prices to retreat and reduces some of the geopolitical risk premium embedded in markets.
So, our message is that investors should definitely remain extremely nimble. Yes, the situation could turn down rather quickly, but it’s not out of the question that a momentum-driven (& liquidity-driven) rally could take place over the coming weeks…especially if the SPX and NDX can push to some compelling new highs.
With this in mind, we want to identify the areas of the market that could benefit the most…if (repeat, IF) a big breakout move does indeed take place……..That is why we will focus next on four individual stocks that, in our view, could outperform if this near-term rally develops….even though our broader six-to-twelve-month outlook remains decidedly more cautious…….We will provide a very short description of each chart...and needless to say, this is not a conclusive list by any means. However, they are some stocks which look poised to rally strongly…if the broad market sees a bullish move between now and the election.
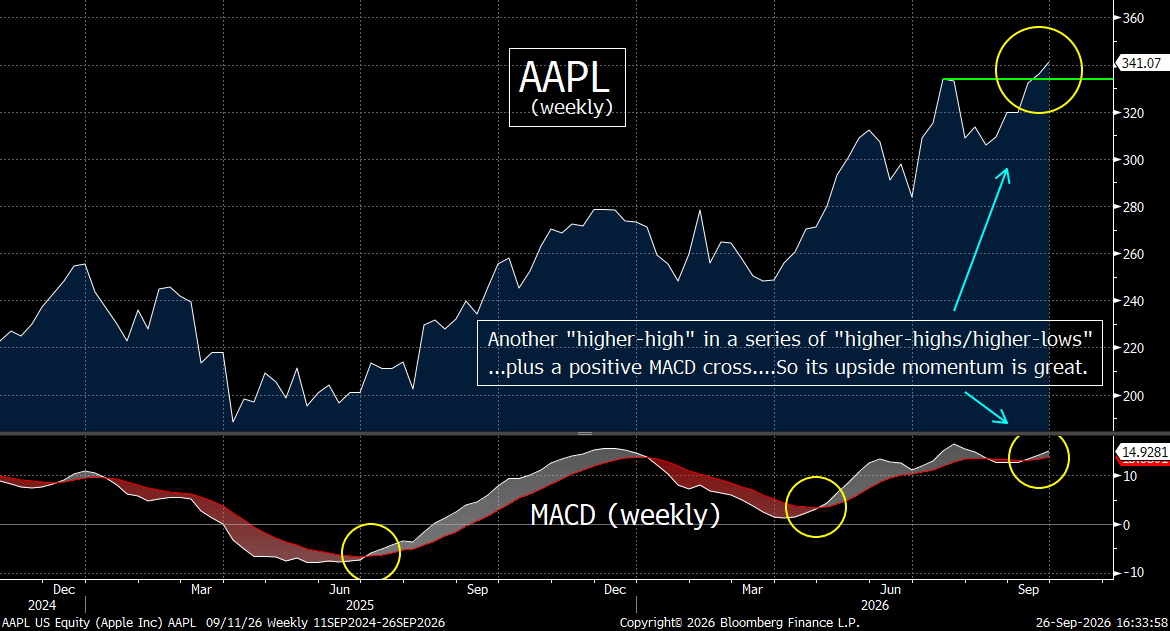
Apple (AAPL)…….This stock has been in a well-defined uptrend for nearly a year…consistently producing higher lows and higher highs…and it recently broke to a new all-time high. The stock has also generated a positive weekly MACD cross…a technical signal that historically has often preceded additional gains. If the broader market rallies between now and the election, AAPL appears well positioned to participate and potentially extend its recent advance.
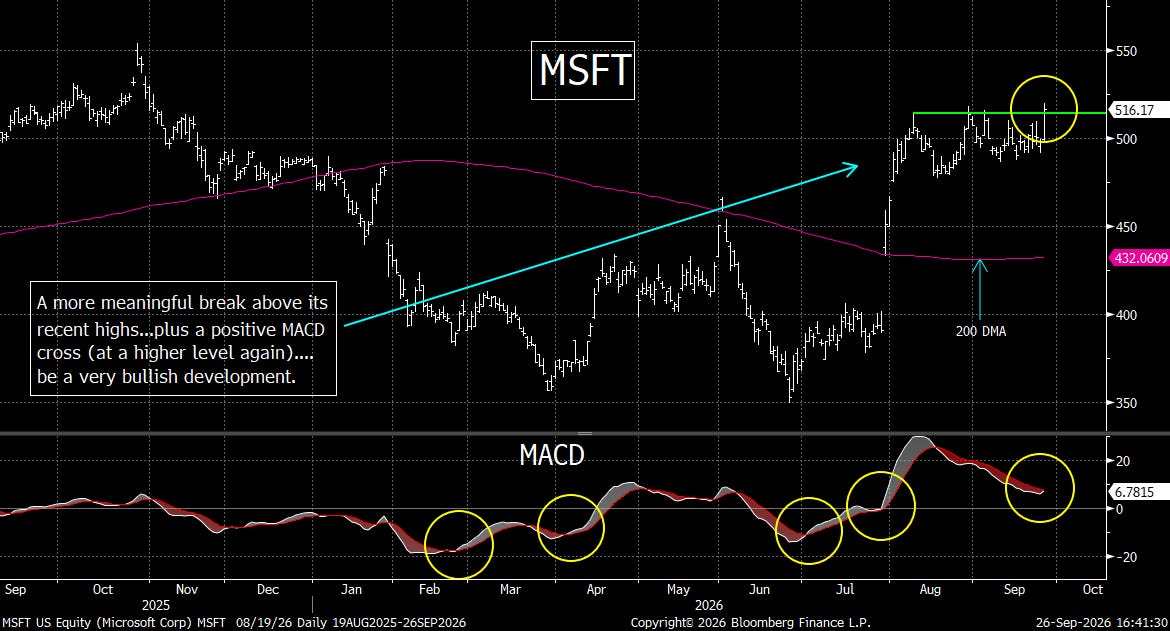
Microsoft (MSFT) has rallied strongly following its earnings report but has spent the past five to six weeks consolidating in a sideways trading range. The stock is now attempting to break out of that range…while also generating a positive MACD cross. So, a decisive move above roughly $520 would strengthen the breakout…and could provide the momentum needed for Microsoft to outperform over the next several weeks.
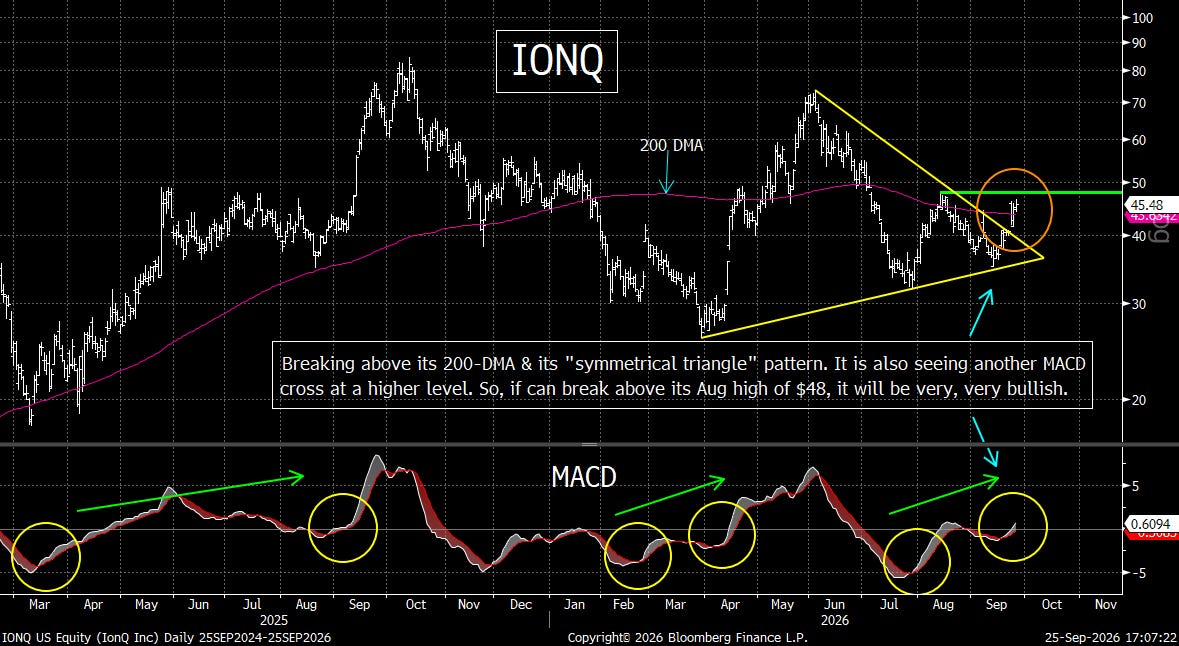
IonQ (IONQ) is breaking out of a “symmetrical triangle” pattern…while simultaneously generating a positive MACD cross…creating an increasingly constructive technical setup. A move above its August highs near $48 would represent an important upside breakout. Such a move could generate significant momentum…and put the stock in position to outperform.
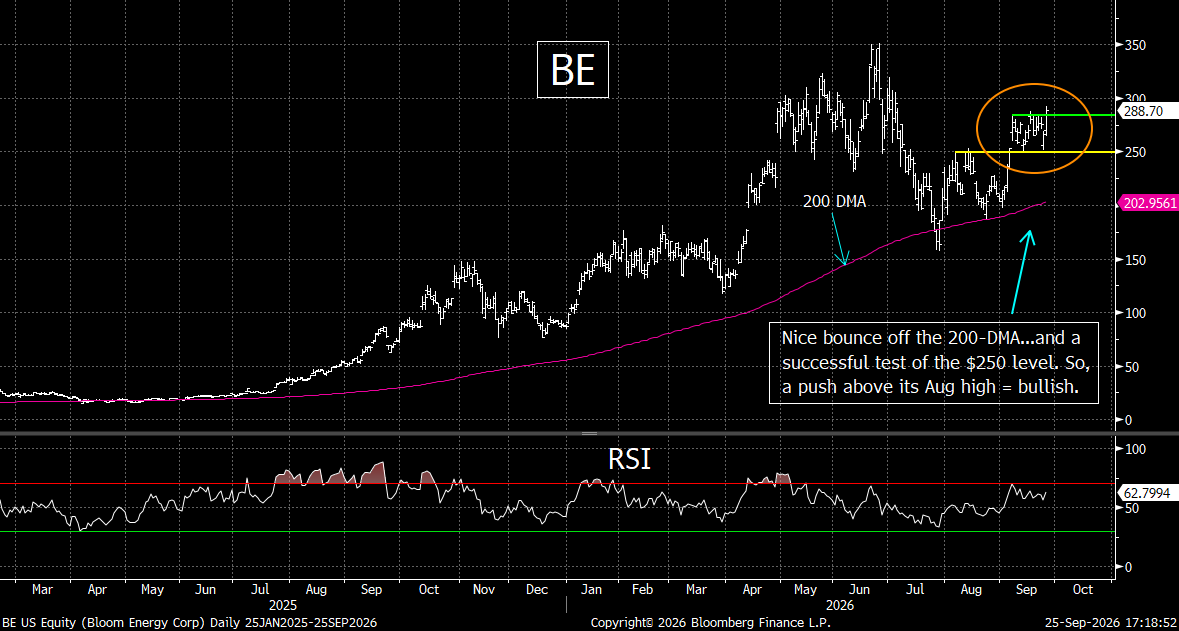
Bloom Energy (BE)…..This stock suffered a sharp midweek decline last week, but staged a very strong rebound…demonstrating considerable underlying buying interest. The stock has also developed two separate “higher-low/higher-high” sequences over the past two months and has once again bounced off its 200-day moving average…the third such successful test in three months. Therefore, a decisive breakout above the $290–$300 area would significantly strengthen the technical picture and could lead to another powerful advance.
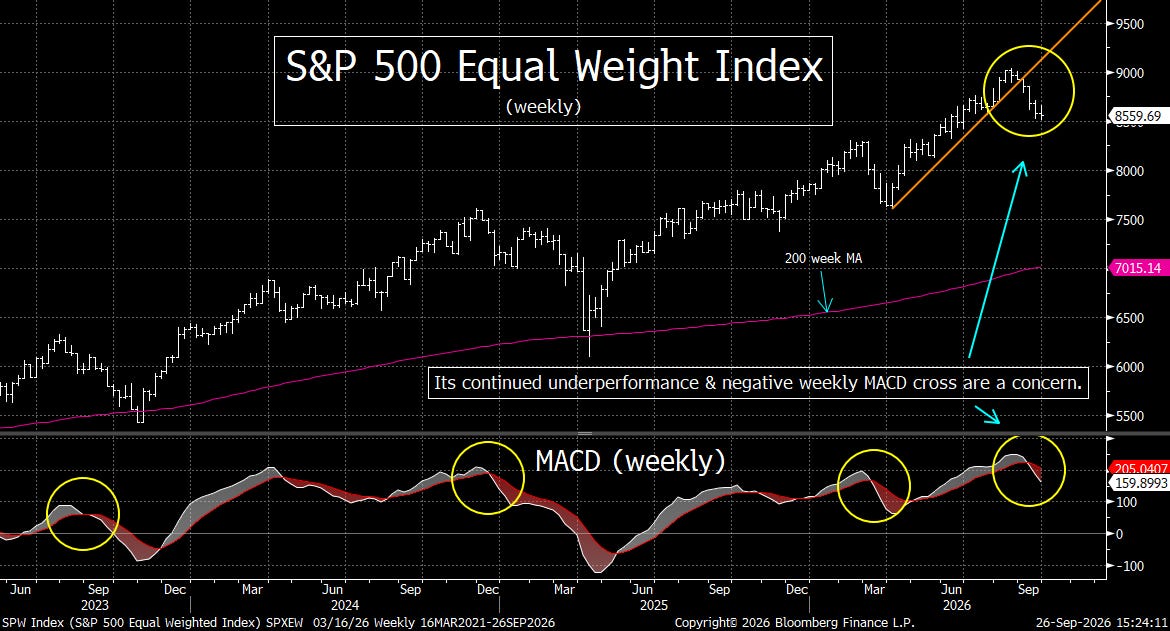
---9) Several important market segments are showing technical deterioration beneath the surface…including financials, banks, consumer discretionary, retailers and the S&P 500 Equal Weight Index……The XLF and KBE have broken…or are testing…important trend lines, while the XLY and XRT are weakening further. Finally, the S&P 500 Equal Weight index has broken below its March trend line with a negative MACD cross…underscoring the narrowness of the market…and raising questions about the sustainability of another broad advance.
As much as we think there are reasons to think that the market could see a boost between now and the election, we do NOT see this scenario as a given. In fact, we still believe that the stock market is extremely vulnerable right now…for the reasons we have spelled out in several different points this weekend.
In other words, even tough we just listed several stocks which could do well IF the market pushes higher near-term…we also want to update several different charts from recent weeks…which provide a further explanation as we why we are concerned about the stock market overall right now. (Like we did in the previous point, we will provide a quick description of these updated charts just above the chart.)……We’re afraid that all of them have deteriorated since we posted them recently, but they’ll have to fall further before they raise any serious warning flags.
We’ll begin with the XLF Financial ETF…which has broken below its trend line dating back to March…while also registering a slightly negative weekly MACD cross. This combination is technically concerning and suggests that momentum in the financial sector is deteriorating. Thus, any additional downside from here would likely confirm a more meaningful change in trend for this important sector.
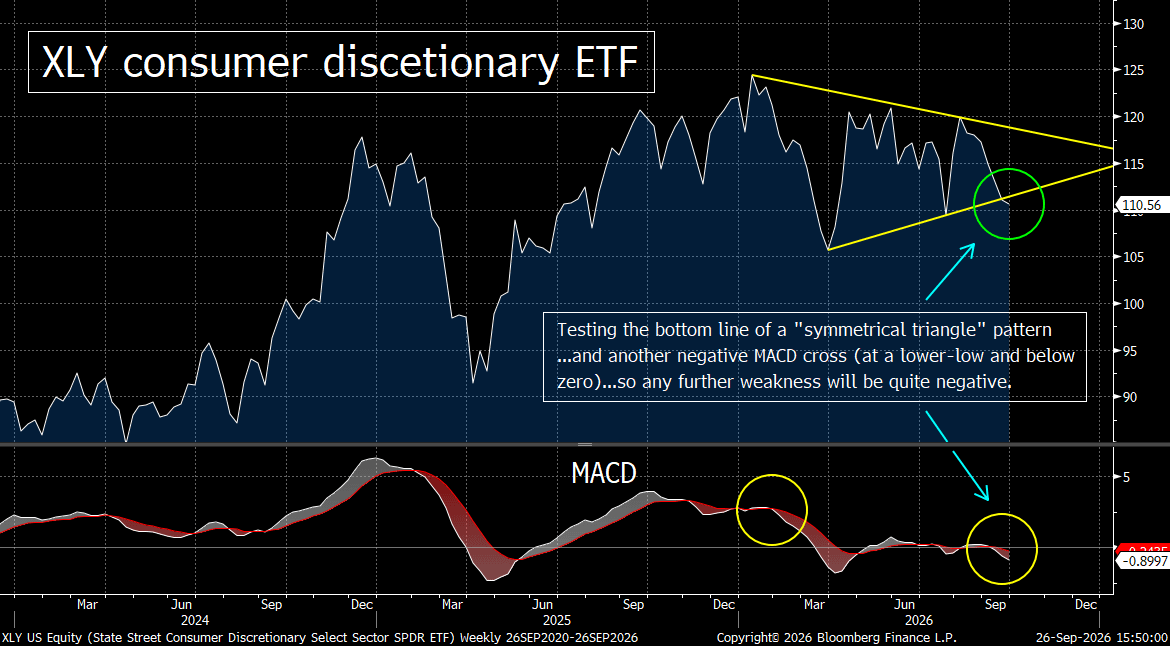
The KBE Bank ETF…is testing a much longer-term trend line dating back to the spring of 2025 and is also approaching its 50-week MA. More importantly, it has already experienced a meaningful negative weekly MACD cross…suggesting that a change in trend may be developing…..A decisive break below the trend line would confirm that deterioration and would be technically negative for the banking group.
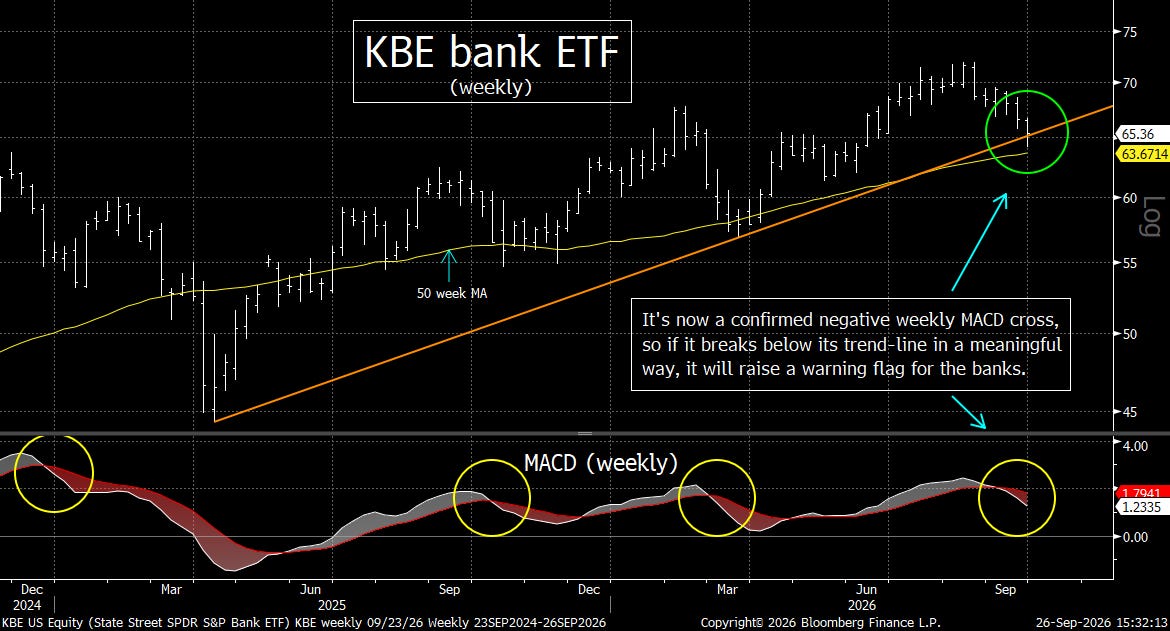
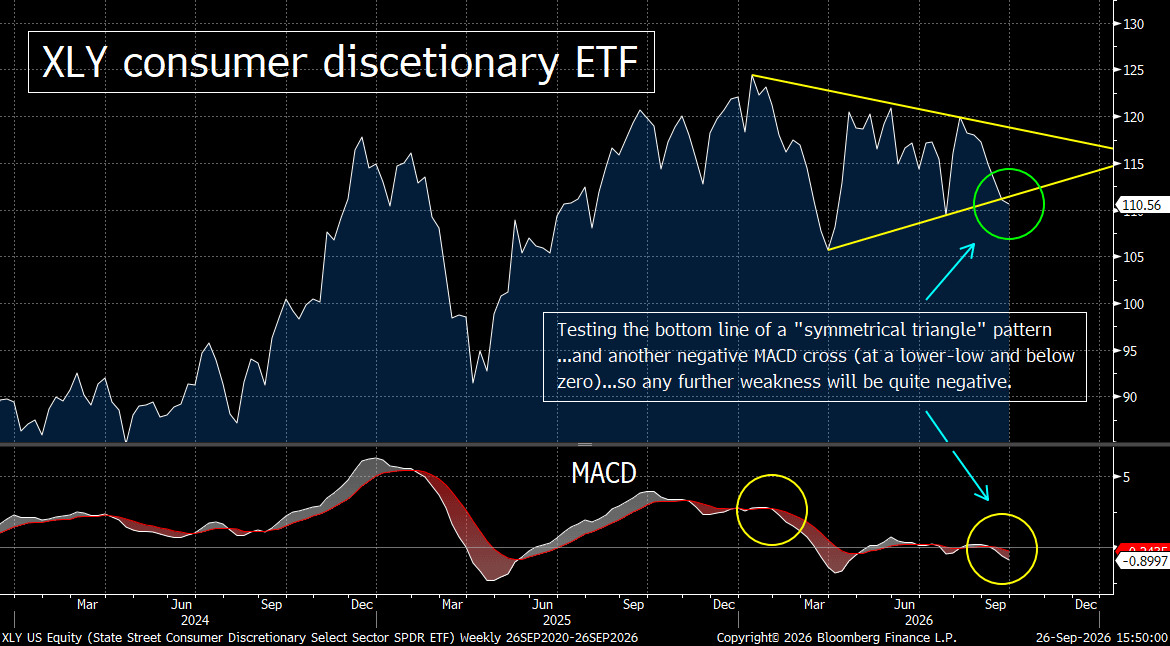
The XLY Consumer Discretionary ETF has slipped slightly below the lower boundary of a “symmetrical triangle”… while also experiencing a negative weekly MACD cross. The key level to watch is 108…because a break below that level would create a significant “lower low.” Any further downside follow-through would therefore strengthen the evidence that the ETF is beginning a more meaningful technical deterioration.
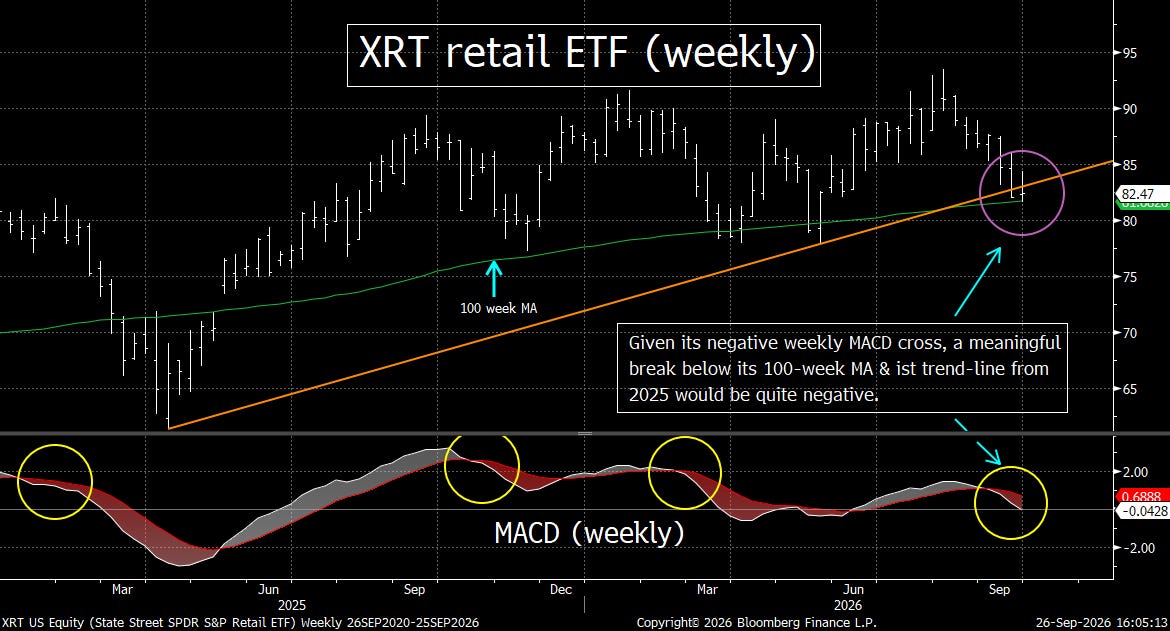
As for the XRT Retail ETF, it has already broken below its trend line dating back to April 2025…and is now testing its 100-weekMA…which has provided important support over the past year. At the same time, the ETF has registered a negative weekly MACD cross…adding to the technical concerns. Therefore, it would take relatively little additional downside to confirm a key change in trend for this important consumer-related group
Finally, for the S&P 500 Equal Weight Index, it has broken below its trend line from March…and has also registered a notably negative weekly MACD cross. On the last three occasions this signal occurred, it was followed by declines of meaningful magnitude. The deterioration in the equal-weight index is particularly important because it underscores the narrowness of the current market…and raises concerns about the ability of the broader market to sustain a further rally.
---10) Summary of our current stance……..We continue to see a very mixed picture in the stock market…with legitimate arguments on both sides of the bull-bear ledger. On the bullish side, there are still several reasons to believe the market could move higher over the near term. The most important of these is the strength of corporate earnings. Earnings estimates remain very strong, and as long as that strength continues, it provides an important fundamental underpinning for equity prices……Liquidity also appears to remain quite plentiful…which is another meaningful positive. Moreover, if the administration can make progress toward an agreement that would bring an end to the war in Iran…and/or help bring oil prices back down…that could provide another significant boost to the markets over the next several weeks.
Perhaps the most important technical factor to watch is whether the S&P 500 and Nasdaq can break decisively above their all-time highs. A marginal move above those levels would not be enough. We would want to see a meaningful breakout accompanied by sustained upside momentum. If that occurs, it could trigger another leg higher and carry the market significantly further in the near term.
HOWEVER, while we recognize the possibility of another rally, we remain quite concerned about the market’s longer-term sustainability. The problem is that we are seeing a large number of conditions that historically tend to appear around significant market tops…….It would be one thing if we were dealing with only one or two warning signs…but when numerous warning signals appear simultaneously, the overall picture becomes much more concerning.
Valuations remain stretched…market breadth is unusually narrow (with the advance has been heavily dependent on a relatively small number of stocks). At the same time, oil prices have risen sharply over a relatively short period…while long-term interest rates have also moved substantially higher. The equity market has a remarkable ability to ignore rising rates and energy costs for months at a time…but history shows that it eventually reacts…and often reacts quite negatively.
We are also increasingly concerned about important divergences. The S&P 500 has not been confirmed by one of its most important leadership groups...the semiconductor stocks, while the high-yield market is also failing to provide the kind of confirmation we would like to see. Add to that the considerable geopolitical uncertainty around the world…and the risk profile becomes even more difficult to ignore.
Given that our longer-term concerns are substantial…and that a further break-down in a small number of them could quickly reverse the outlook for earnings growth over the next 12-15 months…we are leaning heavily to the bearish side of the ledger…and that “lean” will become more prominent if the market holds up until Election Day…….A further rally is far from a lock…and thus investors should remain very, very nimble. Either way, we believe that they should be watching the developments in the ENTIRE fixed income asset class. There is more going on there than most people on Wall Street are discussing.