
Just a reminder, I have another wedding to attend this weekend, so I’m sending this piece out before the market closes on Friday. (Therefore, if you don’t get a chance to read it until Saturday or Sunday, you’ll know why something is not right if something big takes place Friday afternoon.)……This is also why it’s a more abbreviated edition once again this week……….Back to the regular schedule and edition next weekend. Thank you very much and enjoy your weekend!
Table of Contents:
1) With bond yields breaking out, this overbought/overvalued stock market should be due for a breather.
2) The upside breakout move in long-term yields is indeed a very, very compelling one.
3) The tech stocks are extremely stretched on a technical basis. (Many stocks have become very expensive as well.)
4) Just how “narrow” is the stock market’s rally right now?
5) Updating the charts on the S&P 500 Index and the NDX Nasdaq 100 Index
6) This earnings season has also been something that have been very “narrow.”
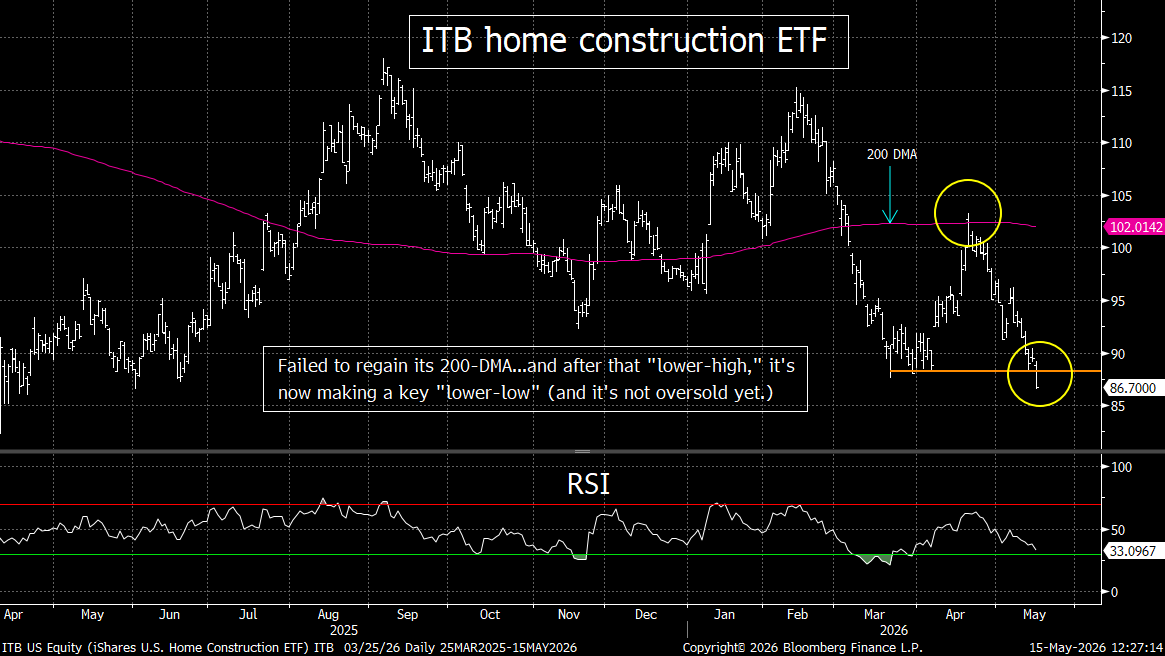
7) Updated charts on the banks and housing stocks. What do they say about the US economy?
8) Summary of our current stance.
---1) The stock market is getting hit pretty hard as we write on Friday morning, but it’s not a big deal compared to the huge rally we’ve seen over the past six weeks. Thus, it’s not something to worry about just yet. That said, there are a lot of reasons to think that…at least over the near-term…the stock market could see a meaningful drop before long. Therefore, we believe investors will need to remain quite nimble ove the coming weeks.
The rally in the stock market over the past six weeks has been extraordinary…especially since it has come despite a further rise in crude oil prices (after oil had already surged by more than 80% since the beginning of the year)…and a push to a 12-month high for long-term interest rates in the US. However, a very strong surge in earnings growth for a handful of companies…and burst of liquidity…has enabled the market to bounce in a somewhat historic way since the end of March.
This does leave the market vulnerable to a pullback at some point soon…and if the Strait of Hormuz does not begin to reopen quite soon, any “pullback” could turn into something more than just a mild affair. In other words, given that this “oil shock” is reaching the kind of length and price movement that has always been followed by deep corrections (or worse) in the stock market over the past 50 years….and given that we’re getting strong signals that an important change in trend for long-term interest rates is taking place right now…today’s overbought and expensive market has become riskier than most investors seem to realize right now.
Yes, as we all know, valuation is a lousy timing tool…and there are many on Wall Street who believe that the level for the price earnings ratio which designates “fair value” for the stock market has risen considerably in recent years due to the technological advances of AI…and therefore the current multiple of 22x is nothing to worry about. Besides, the market has been able to hold up at this kind of reading for extended periods of time in recent years. However, with the price/sales ratio…and the price/book ratio…both at record all-time highs (WAY above the readings at previous tops), it still raises questions about how much higher the market can run…at least over the near-term.
We also have a situation where the stock market is becoming overbought on a technical basis. This is particularly true for the tech laden NDX Nasdaq 100…and for the tech ETF’s…especially the chip stocks. (More on this in point #5)…..On top of this, the rally has been EXTREMELY “narrow”…and that is something that has been followed by declines that are more than 2-3% drops in the past. (More on this in point #4.)……More importantly, the fundamental improvement in the economy has been very “narrow” as well…with only a handful of companies driving the big rise in earnings estimates…and the earnings growth outside of the tech sector in the low single digits.
We’d also note that sentiment is pushing to extreme levels…with bullishness among futures traders pushing above 80% for both the SPX and NDX during this past week. Also, Wall Street strategists have been tripping over themselves to raise their year-end price targets on the S&P 500…much like they did in early 2025…just before the 17% (deep) correction began for the S&P 500 (-20% for the NDX).
None of this means that the bull market which began in October of 2022 is coming to an end. If the level of net-liquidity in the system remains strong, any near-term decline should be limited to what we saw in March…or even something smaller. However, if those who say that the situation in the private credit market is nothing to worry about are wrong…an increase in stress in that market will definitely drain liquidity from the marketplace…and that could create the kind of headwinds which could lead to a full correction in the stock market.
Be that as it may, the bulls have been firmly in charge for most of this year…and there are reasons to think that the “Trump put” is still firmly in place (given the mid-term election)…and that the “Fed put” is also firmly in place (now that Warsh is taking over). Therefore, the advantage remains firmly with the bulls right now. However, we just want to point out that there are some serious risks involved in chasing the stock market in an aggressive manner up at these levels.
Besides, the Patriots lost the Super Bowl this year (like they did in 2008)…the Red Sox are in last place…and the Celtics and Bruins lost in the first round of the playoffs!!!.........Thus, the odds are OBVIOUSLY much higher than usual this year that a big bear market is just around the corner!!!.....”Wilson, get in there and sell, sell!!!”……….Seriously though, there are quite a few developments which have indeed taken place recently that are usually associated with a material pullback in the markets in the past, so investors should be a bit more careful going over the coming days and weeks.
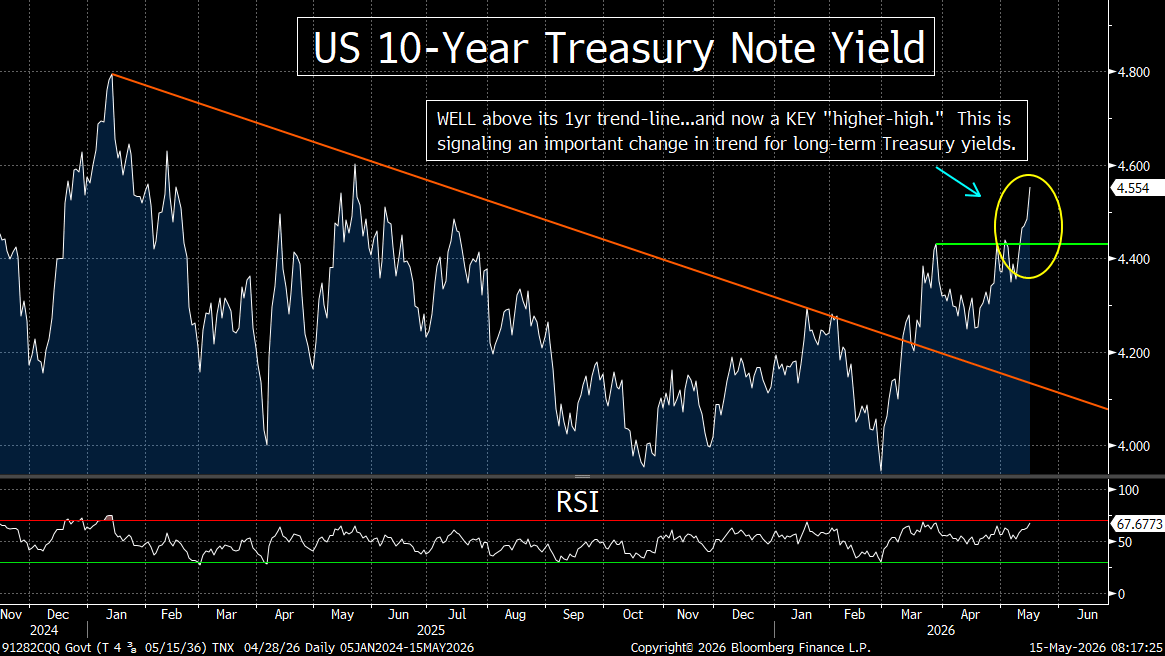
---2) The continued closure of the Strait of Hormuz…and the inflation data coming in higher than expected this past week…bond yields have pushed above their KEY 4.4% resistance level in a meaningful way. In fact, they are pushing above 4.5% today (Friday), so unless they reverse lower almost immediately…and quite sharply…it will confirm a change in trend for the intermediate-term outlook for the stock market on a technical basis…..We’d also note that the action in the high yield market continues to raise concerns for us.
The Treasury market had a very tough week this past week…and the decline in price, and the corresponding rise in yields, was something that should raise some considerable concerns among investors about the fixed income asset class over the coming weeks and months. This in turn, could/should raise some problems for other asset classes as well.
Don’t get us wrong, there are some very good reasons to believe that yields will reverse lower at some point in the second half…… We agree that this should take place, but it does not mean that the yield on the US 10yr note won’t push higher over the coming weeks and months. (If, repeat IF, that takes place it will likely create headwinds for the stock market.)
No matter what it might mean for the stock market, this is a bearish development for bond investors. Again, if this market can reverse VERY quickly, the pressure will ease…but the recent action in the long end of the Treasury market is signaling an important change in momentum to the downside for bond prices…and to the upside for yields.
The yield on the US 10yr note had already broken well above its 1-year tend-line…and made a “higher-low” in April. This past week, it followed these moves…with a clear “higher-high”…and this is something that is confirming an IMPORTANT change in trend for longer-term rates.
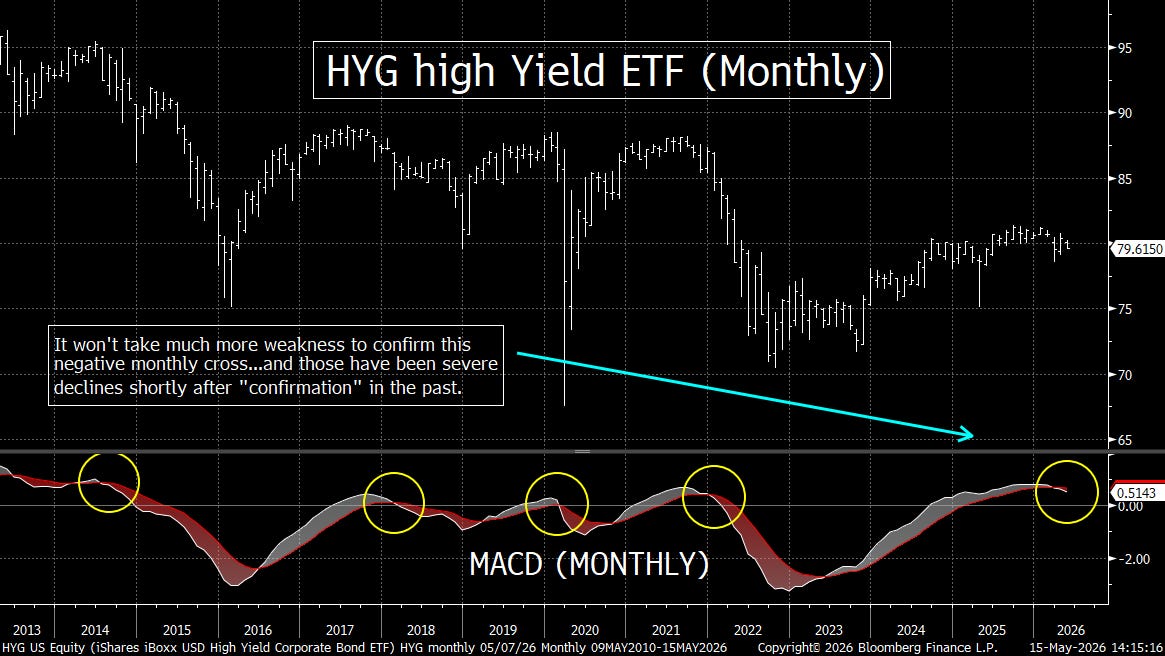
We also want to reiterate that the situation in the high yield market is something which could create some real problems for the credit markets. The inability of the HYG high yield ETF to make new highs…at the same time the stock market is making a meaningful new high…is the kind of divergence that sends up some material warning flags. This is especially true since the HYG has begun to decline again over the past 2-3 weeks. As we highlighted last weekend, the negative monthly MACD cross for the HYG is something that has been followed by significant decline in the past for the junk bond market. Therefore, it won’t take much more weakness in this ETF to raise a warning flag on this asset class.
Given that this area of the credit market is one notch ABOVE the private credit market…any material stress in the high yield market will not bode well for the private credit market…as we move into June. Remember, private credit investments are redeemable on a quarterly basis…and that’s why we heard about the growing stress in this area back in March. Well, June is just around the corner…so we’ll be hearing more about this issue before long. If what is going on in the HY market is any indication, another rough patch for private credit could/should hit the marketplace soon.
---3) The tech stocks have seen an extremely strong run since the end of March…with the chip stocks seeing parabolic rise. Some of those names have become very expensive…and pretty much all of them had become extremely overbought by Thursday of this past week. In fact, the tech ETFs are now reaching the kind of overbought conditions that have been rarely seen over the past 50 years. So, we expect the group to see a material pullback very soon.
We highlighted the fact that the tech sector was becoming quite overbought on a short-term basis last weekend. Well, it had become even more overbought by Thursday’s close. Thus, we believe, will lead to a material decline in this all-important leadership group before long…..We do have to point out that Nvidia (NVDA) reports earnings next Wednesday, so this sector might be able to avoid a meaningful decline for a bit longer. However, as good as the news has been for the chip group, many of them have become extremely overbought. So, they should be due for a material decline at some point very soon.
We’d also note that some of these chip names have become extremely expensive…with AMD’s multiple jumping from 30x to over 60x in just six weeks…and INTC’s multiple pushing above 100x. Therefore, they are stretched on both a fundamental and technical basis……We’d also note that our bullish call on NVDA has worked out well…with its 15%+ rally since we highlighted it. However, it’s becoming quite overbought as well. Therefore, there is a risk that we’ll see a “sell the news” reaction to their earnings for the stock…and the group.
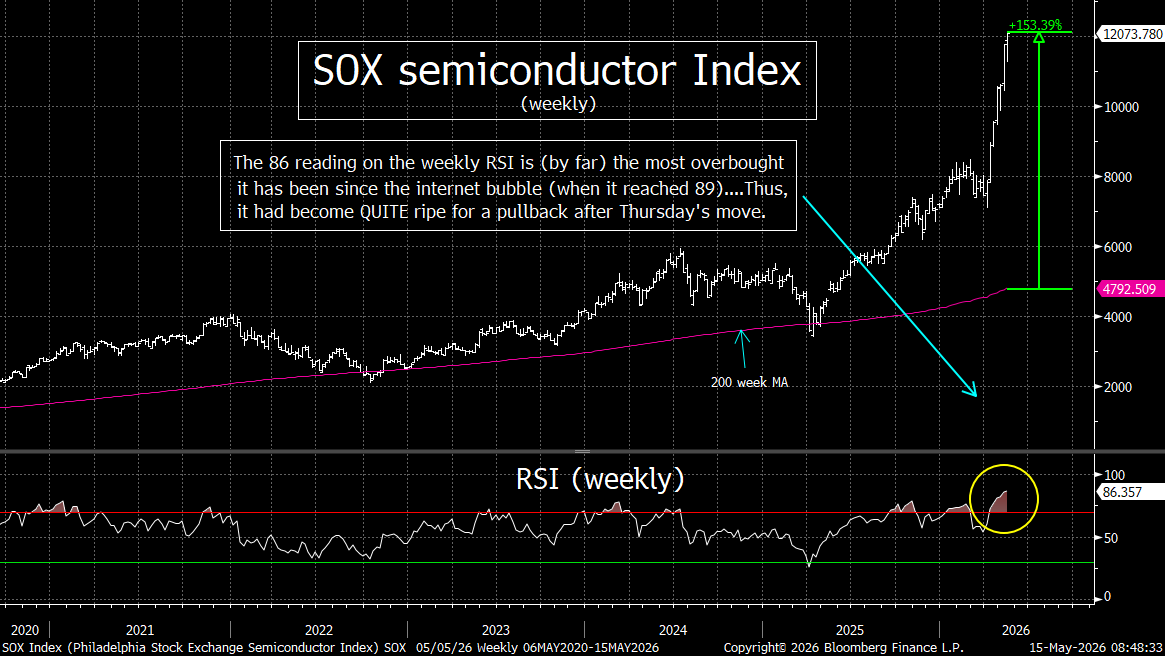
Looking at the first chart below, you can see that the SOX semiconductor ETF has become extremely overbought…with an 86 reading on its weekly RSI chart…and a push to over 150% above its 200-week moving average. This RSI reading is the highest since 2000…when it reached 89. So, although there has been one time when the chip group has become even more overbought before it has topped out for a while, it has not been much more overbought…even in the biggest tech bubble in history.
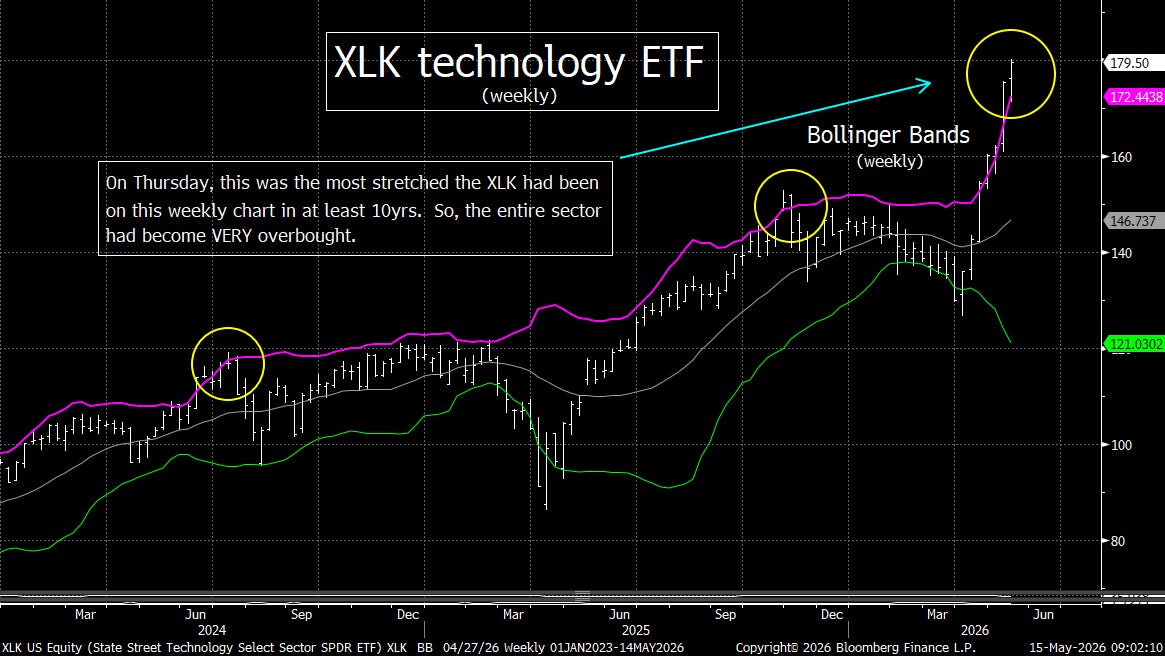
The second chart further shows how extended the tech sector has become. The XLK tech ETF is now trading much more than 2-standard deviations above its 20-week moving average. (In fact, it has reached 3-standard deviations above that line.) This is a level that has been followed by material declines in the past 10 years…so this is another reason to think that this all-important sector is getting ripe for some weakness in the not-too-distant future.
To be honest, we believe that the tech bulls should be hoping for a meaningful decline soon. No market moves in a straight line…so if the SOX and XLK can take a breather soon, it should actually be healthy for the tech stocks. When an group gets as stretched as this one has become recently, a further rise will only raise the odds that crippling reversal will take place further down the road…if it does not take a breather at some point……When the tech sector sees a straight-line rally, it builds up the kind of leverage which can cause a major crash at some point in the future…if the rally does not take time to digest its gains every once in a while.
---4) We have all heard about how “narrow” the rally has been since the late March lows. However, we wanted to put together a list of some of the examples of just how narrow the rally has been…to give it some more perspective. So, here we go:
---The S&P 500 cap weighted index has rallied 15% since March 31, while the S&P 500 Equal Weight Index has advanced just 6.1%. Also, the NDX Nasdaq 100 (63% tech stocks) has rallied 24.7% over that time.
---Mega cap tech stocks are running at roughly 2-3x the S&P’s pace (AVGO +42%, GOOGL +39%, AMZN +28%, etc.).
---Those top 3 stocks alone are driving almost 75% of the tech group’s gains since the lows.
---According to Citadel, only 22% of S&P 500 has outperformed the index itself over the last 30 days…the lowest in 30 years.
---About 270 S&P 500 stocks are positive…meaning only slightly more than half of the index has participated in this rally.
---The median S&P 500 stock has retuned 1.6% vs the cap-weighed index return of 15%. (That an exception gap.)
---Only one stock of the top 10 performers in the S&P 500 since the end of March comes from outside the tech sector (HUM…which is 9th).
---According to BofA, the private client allocation to equities is now at its highest level since 2021.
---Tech capex is 50% of all S&P 500 capex.
---Since April 20th, the S&P 500 has rallied over 6%...while the S&P 500 cumulative A/D line has declined by almost 1%.
---The share of mutual funds outperforming the S&P 500 this year has plunged to 28%...down from 60% from the end of February.
---(In other words, diversification is getting clobbered…as those funds cannot keep up with a rally driven by just a handful of stocks.)
---The SOX semiconductor index has seen its best 25-day performance since the internet bubble.
Needless to say, this is far from a complete list. However, it does shows that this is one of most concentrated rally on record…with the gains concentrated to the AI-linked chip stocks, plus a few other hyperscalers. Otherwise, the stock market isn’t doing much of anything. When you combine this with the fact that outside of the tech sector, earnings growth is just 3%...it shows that the “narrowness” of this rally is also a fundamental issue, not just a technical one!!!
We have seen very narrow rallies on many occasions in this century…and basically all of them have ended with at least a meaningful decline…and in some cases, a bear market. The examples of 1999-2000…as well as the failed rebounds of 2022 and very early 2023. The same can be said about 2007, 2018, 2019…and early 2020. All of these narrow rallies ended with outsized declines…so this is another signal that investors will want to stay a lot more nimble as we move through the second half of Q2.
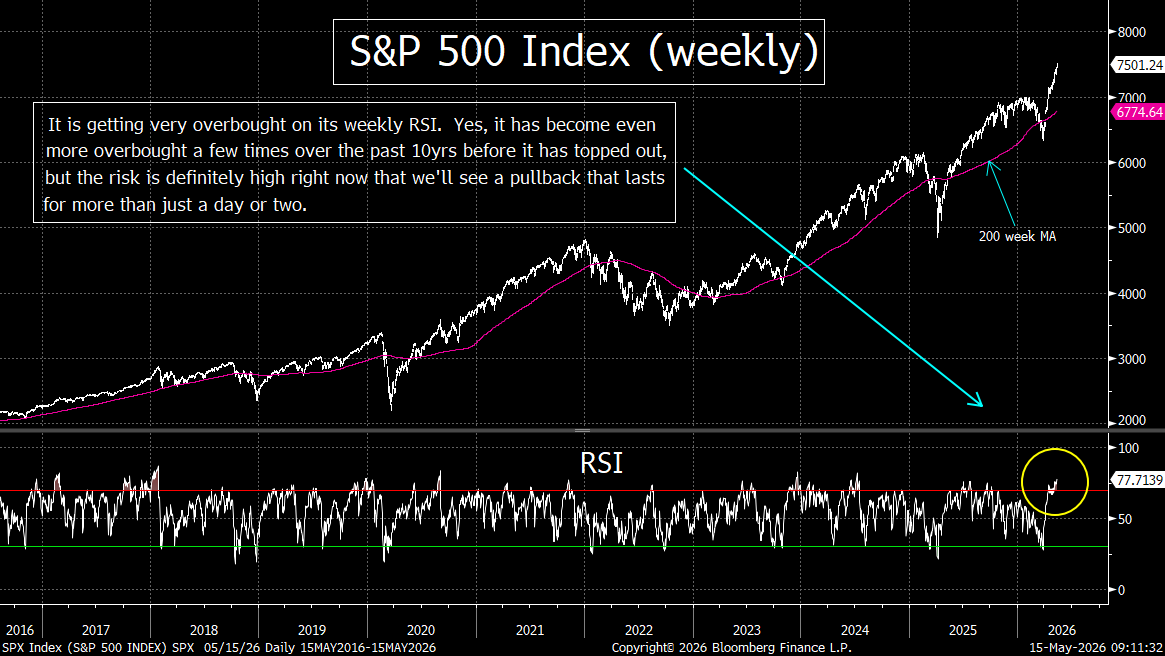
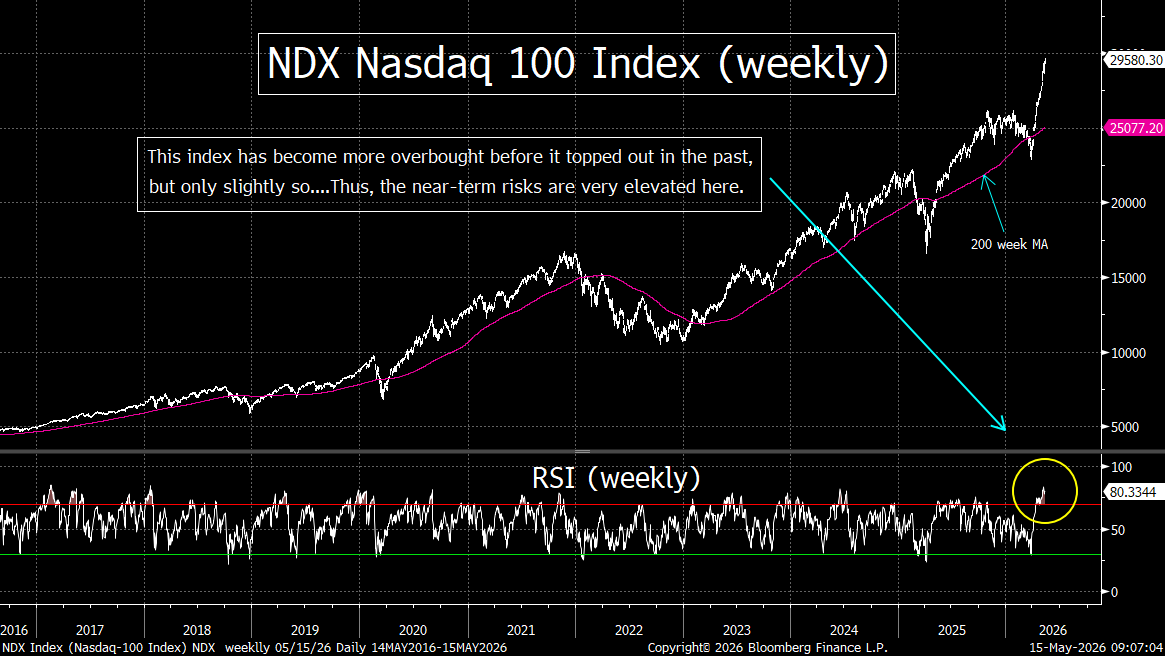
---5) Index Charts…….The S&P 500 Index and the NDX Nasdaq 100 Index had become even more overbought on their weekly charts compared to where they stood last weekend. The SPX has become even more overbought before it has seen a pullback in the past, but it’s still quite extended. As for the NDX, it has also become more overbought, BUT not by much. So, it is quite vulnerable in our minds.
Let’s take a quick look at a few charts. The weekly RSI chart on the S&P 500 has become even more overbought on several occasions before it has rolled back over during the past decade. So, we have to admit that this index could push higher for a while longer. That said, the NDX has only become more overbought before rolling over a handful of times in the past decade. And in each one of those instances, it only became slightly more overbought before dropping. Therefore, the risk levels are definitely elevated right now.
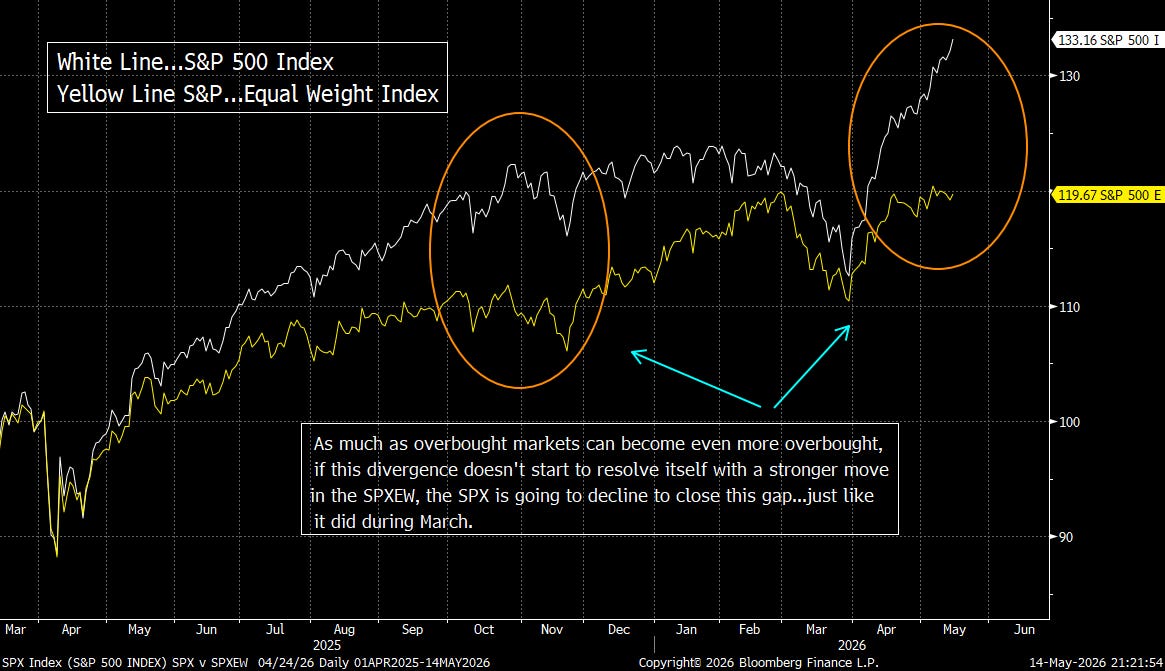
We’d also note that the gap between the S&P 500 Cap-weighted Index…and the S&P 500 Equal-weighted Index has become even more pronounced than it did in November of last year and February of this year. This is another indication that the today’s “narrow” market is on shaky ground.
---6) This earnings season has been a great one, but the growth continues to be highly concentrated in a handful of companies. When you look past the data on “expectation beats”…and look where the growth is actually coming from…it shows that the earnings picture is not as strong as the Street’s narrative is trying to indicate right now.
From a headline perspective, the earnings results for the S&P 500 have clearly exceeded expectations. Roughly 83–84% of companies have reported earnings above consensus estimates…a figure that stands well above the historical norm in the mid-70% range. Moreover, the magnitude of these beats has been impressive, with the average company exceeding earnings expectations by approximately 12.6%...which is another sign of stronger-than-expected profitability.
Even more striking is the overall growth rate. First quarter earnings growth for the index is tracking near 25%, which is roughly double what was expected at the start of the reporting season. On the surface, this kind of upside would typically signal a broadly accelerating earnings cycle…and a fundamentally healthy equity market backdrop.
However, the composition of that growth is where the concern lies. A relatively small group of AI-driven and technology-oriented companies has been responsible for a disproportionate share of the gains. Specifically, just 44 AI-related names have contributed more than 70% of the total earnings growth for the index. These companies are seeing extraordinary expansion…with earnings growth rates averaging over 40%...driven by continued demand for artificial intelligence infrastructure, semiconductor capacity, and related technologies.
When this narrow leadership is stripped out, the broader earnings picture looks far less robust. As we highlighted earlier in this piece, if you exclude the technology sector, first quarter earnings growth for the S&P 500 drops to just 3%. That stark contrast highlights how dependent the overall index has become on a single theme…AI and the technology ecosystem surrounding it.
This lack of breadth is also evident in forward expectations. Since mid-2025, earnings estimates for most S&P 500 sectors outside of technology have remained essentially flat. In contrast, technology sector estimates have surged approximately 25% over the same period. This divergence underscores a market that is increasingly concentrated in both performance and expectations.
Additionally, some economically sensitive sectors are seeing outright deterioration. Consumer discretionary earnings estimates, for example, have been cut by roughly 9% over the past three months, reflecting pressure on the consumer and a more cautious outlook for spending.
There is absolutely no question that the earnings growth for this year has been very strong. Right now, the fact that it is so highly concentrated is not something investors are worried about…as they seem to believe that it will broaden out eventually. It’s just that they’ve been waiting for three years now…and it has not come to fruition in ANY meaningful way…….Yes, we understand that the excess liquidity in the system makes it seem like this very narrow increase in earnings will be enough to keep the market rallying strongly throughout the rest of the year. In fact, that liquidity might be able to do the trick for quite a while longer. However, we just think it’s important to discuss what is really going on with this situation today.
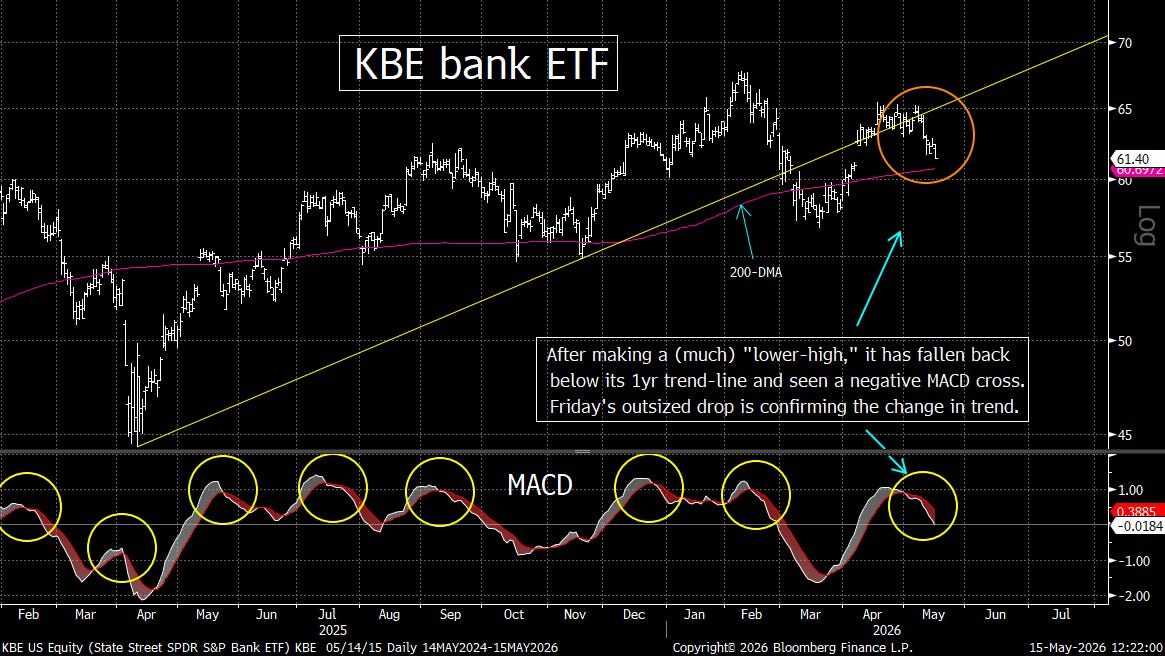
---7 We’d just like to update two charts on the ETF’s of two areas of the stock market which are very economically sensitive…..They are showing that the outlook for the economy is not as bright as many on Wall Street would like to portray it.
---8) Summary of our current stance……..By several standards, the rally in the stock market since the beginning of March has been an historic one. The 18% rally in the S&P 500 over the past 32 trading days is something that usually only happens after deep correction which is culminated by a major “washout” bottom…AND after it comes very cheap. This time around, the SPX had not even reached correction territory…and barely fell below 20x forward earnings. So, there is little question that the current rally has been a spectacular one.
Most of the credit is going to the current earnings season…which is starting to wind down. Earnings estimates have pushed nicely higher during this season…and the consensus is now looking for an increase of 22% in 2026!....The main driver for the rally in the market…AND for the rise in the earnings estimates…has come from the chip stocks and a small number of hyperscalers (who are buying the vast major of those chips). The demand has been relentless…and it is not showing any signs of abating any time soon.
One concern that derives from this action is the extreme “narrowness” of this rally. Again, this “narrowness” exists in both the number of stocks which taking the market higher…AND the number companies which are pushing the earnings estimates higher. In fact, you have to go back to the internet bubble to find a time when so few stocks were pushing the market to news highs. When you combine this with the idea that the companies outside the tech sector are only looking for a 3% increase in earnings…it raises some warning flags for investors. In other words, if history is any guide, this recent “narrow” rally will likely be followed by a decline of some magnitude before too long.
Then again, maybe history is not a very good guide in this instance. Maybe the AI phenomenon will has indeed created a “new economy” (or a “new normal”). Maybe the fair value level for the market has shifted from a 16x multiple to a 22x multiple…and maybe the strength of the individual investors, the “Fed put”, the “Trump put”, “positive gamma”…and other issues like these…have indeed made things different this time.
Our concerns are that there are other things out there as well. To start with, there is also something called “negative gamma”…and leverage of all kinds work in the opposite direction when things get out of hand. Also, with today’s massive levels of debt and leverage in the system, it will not take a major recession to have things begin to unravel. Yes, there is A LOT of liquidity in the system today, but when the level of stress in the credit market begins to grow, that “net liquidity” equation can shift very quickly. This is especially true when debt…especially risky debt…reaches very high levels…like they have today. (It does not take much weakness in the economy to create some outsized problems.)
We also have the war in Iran…and we understand why JP Morgan said last week that the Strait of Hormuz will reopen by the end of June “one way or the other.” We have not seen that report, but we do think it’s safe to say that they are inferring that it might be reopened by force. In other words, a re-escalation of the war is not out of the question…especially now that the summit in China is behind us.
Having said all this, we realize that valuation is a LOUSY timing tool…and that liquidity can be an extremely powerful force in the markets. Therefore, this rally could last several more weeks…and maybe even quite a few more months. However, this does not mean that the risks are not extraordinarily high right now…..There’s a reason that investors are buying such a highly concentrated number of stocks. It’s because very hard to justify buying most other companies! Thus, if earnings growth do not broaden out, it’s going to be a lot harder to justify a further rally…and things could become quite ugly…quite quickly…if the net-liquidity equation ever turns negative for one reason or another.