
Buckle Up, the Fed has Confirmed that We're Headed for a Recession.
I will be having some minor surgery this coming Wednesday. Therefore, next week’s “Weekend Insights” will be a very, very abbreviated piece…and there will be no editions of “Before the Open” over the second half of this coming week. Thank you very much.
Table of Contents:
1) The Fed has confirmed they’re not close to “pausing” yet…and certainly not “pivoting.”
2) The Fed is tightening into a recession…& they don’t want a big rally. What more do you need to know?
3) Let’s shift our focus to the economy…and it’s getting worse.
4) Updated charts on the S&P & NDX…..They’re looking quite dicey.
5) When yields reverse lower in a stock bear market, it’s NOT bullish for stocks.
6) Gold is finally showing some signs of life.
6a) Ethereum has been dead money, but it MIGHT be poised to breakout soon.
7) European banks are overbought…avoid them.
8) Natural Gas testing key resistance levels.
9) Midterm election….Predictions.
10) Summary of our current stance.
1) In our opinion, Chairman Powell confirmed last week what we’ve been saying for many months: Just because the Fed will inevitably raise interest rates at smaller increments at some point going forward, that is NOT the same thing as a “pause”…and not anything close to anything that could be called a “pivot.” Therefore, this mild change in policy will not be as bullish as many people had been thinking recently.
One of the key themes that we have been harping on for many months now is a change in the size of rate hikes (to smaller hikes) is not something that would be very bullish for the stock market and other risk assets. We DID say that a move towards smaller rate hikes would cause a short-term bounce, but we felt it would not create a sustained rally…and we still feel that way. The simple reason for this opinion is that (as we have said…and shown)…history tells us that it takes a change in policy that includes an injection of large levels of liquidity into the system…and/or actually cutting short-term interest rates…to create a sustainable rally in a stock market that is not cheap. Also, it is all but impossible to create a sustainable rally with this kind of mild change when the market is still expensive…like it is today.
Yes, theoretically, a mere change from large rate hikes to smaller ones COULD be bullish…IF the stock market has become cheap. However, it’s NOT cheap right now. More importantly, we cannot find any examples when the Fed has done a “real pivot” (that included a big liquidity injection) before the stock market became cheap. Therefore, we don’t even know for sure that a change to smaller hikes would work in that situation. What we DO know, however, is that is HAS taken a “real pivot” to create a lasting rally in the stock market after “tightening induced” bear market. Since we haven’t gotten a “real pivot,” a sustainable rally is extremely unlikely…and a further decline is a very reasonable outcome to expect going forward.
It's hard for us to think of a way that Chairman Powell could have been clearer in telling the markets that they’re going to continue to feel some considerable “pain” in the coming months. Instead of the “lower for longer” mantra that existed for much of 2021, Mr. Powell has two completely different narratives today. They now are “higher for longer” and “slower but ultimately higher” for short-term interest rates.
Of course, his comment that it is “very premature to even think about pausing rate hikes” was about as direct as anyone could have expected…and thus it was no surprise that this sentence caused the market to roll-over in a considerable way on Wednesday. However, when Mr. Powell also said that the risk of not tightening enough is the bigger risk right now…it told us that the Fed wants to keep monetary policy tight for quite a long time. In other words, the Fed believes that the risk of doing too little is much bigger in his opinion than doing too much tightening…and thus rates are very likely going to remain elevated even when they stop hiking them. This is NOT what the stock market had been pricing-in during its October rally…and as we just highlighted, it’s not conducive to a rally in risk assets……..Don’t fight the Fed…Don’t Fight the Fed…DON’T FIGHT THE FED!!!
2) There are two other items that deal with what the Fed is doing right now that we believe not enough investors are focusing on. First of all, the Federal Reserve is continuing to tighten policy…at a time when we are heading into a recession. (Hello, what more do you need to know????)....Second, the markets have become an important tool for Fed policy since Ben Bernanke was Chairman…and they want to keep a tight policy in place right now…(which means they DO NOT WANT markets to rally in a significant way).
We can argue all we want about whether what the Fed is doing is the right thing or the wrong thing with their existing monetary policy. The Fed has been basically telling us for a long time that they have decided to choose what they think is the lesser of two evils. By tightening monetary policy in order to dampen inflation…instead of letting inflation run wild…they believe that although they will likely cause a recession, they will prevent a very deep recession later on…….To repeat, if you read between the lines, that’s what they’ve been telling us all year. It’s just that they finally came out and explicitly said it this past week. (Mr. Powell confirmed this when he declared that the risks involved in doing too little are much higher than they risks involved in doing too much.)
They might be wrong with their assessment, but it IS the assessment they’ve made! Thus, we strongly believe that investors have to move past worrying about what they believe the Fed “should” be doing…and concentrate on what they IS doing…AND what they WILL likely do in the months ahead……..They’re going to keep raising interest rates…and they are very much intent on keeping those rates elevated for quite a long time! Therefore, investors NEED to act accordingly!!!
The second item we think investors are not focusing on is that the Fed actually does NOT WANT the markets to bounce back in a significant way. (Why do you think they became so extremely hawkish once again in August…after the big summer rally???) Nobody wants to say this out loud, but it’s true!!!.....People need to realize that the stock market is no longer the kind of “leading indicator” it for where the economy is going that it has been over the decades. Instead, it has been a tool to actually IMPACT the economy…ever since Ben Bernanke made it one…with his QE programs coming out of the Great Financial Crisis. (In fact, he said publicly many times a decade ago that their goal was to boost asset prices in order to help the economy grow.) The problem is that we have not been able to wean ourselves off that policy. Therefore, the Fed KNOWS that if the stock market (and other risk assets) rally in a substantial manner, it’s going to work against their goal of keeping monetary policy tight.
We realize that what the Fed is doing is very frustrating to many pundits…because they think the Fed is doing the wrong thing. They think that demand destruction will cause inflation to fall significantly…even though today’s inflation is mostly supply driven. They very well might be correct. However, this is not what the Fed believes…so investors must react to what the Fed is actually doing…not to what they believe the Fed “should” be doing.
It’s fine that these pundits keep arguing that the Fed should be following a different strategy. However, they should not be telling investors that the markets are going to be fine…because the Fed will “should” start changing their policy now…or “should” start changing it sometime in the not-too-distant future. These pundits have been saying this for months…and the Fed has not changed its tune at all……Until the Fed actual does follows a different strategy…or signals that it’s going to completely pivot (not just “pause”…or something less than a “pause”)…these pundits should remain wary about how the markets will act going forward in our humble opinion. Again, it’s fine that they keep saying that what the Fed is doing is wrong, but the Fed does not agree that what they’re doing is wrong…and for now, they’re going to keep their policy quite tight!!!.....…….Don’t fight the Fed…Don’t fight the Fed…DON’T FIGHT THE FED!
3) Having said all this, we do need to point out that it is our opinion that the focus for investors is going to shift to the economy before too long. We continue to see more signs that the economy is headed for recession. This past week, shipping giant, Maersk, added to the warnings that many other companies have been providing during this earnings season…….Therefore, even though we don’t want to lose sight of what the Fed is doing with their tight monetary policy, we also need to keep a close eye on the fundamental backdrop we are very likely going to be facing in 2023. (Who cares if the Fed is going to stop tightening early in 2022…if they’re going to keep rates elevated…and if earnings are going to drop in 2023?)
Despite all the time we have just spent talking about the Fed and their tightening policy…and even though we will continue to pay very close attention to the Fed…we have also begun to shift our focus to a certain degree going forward. We now share our attention equally between what the Fed (and other global central banks) are doing…and the economic and earnings outlook we’re likely going to see over the next 6-12 months. The main reason for this shift is that we believe that investors will soon finally come to realize that the deep stock market declines that take place during a bear market…especially ones that include a recession…do not bottom until the stock market becomes cheap.
We believe that too many pundits have spent much too much time trying to figure out when the Fed is going to pivot. Sure, we understand why they have tried to do this. They know that once the Fed pivots…(and we mean when they REALLY start to pivot...buy easing their policy…not just by slowing the intensity of their tightening policy)…the market tends to bottom.
HOWEVER, ONE OF THE KEY ISSUES THAT ALMOST ALL PUNDITS NEGLECT TO CONSIDER IS THAT THE FED NEVER PIVOTS UNTIL THE STOCK MARKET BECOMES CHEAP! (In fact, they never seem to pivot when the market reaches fair value either.) They always wait until things get really bad. In other words, history tells us that the Fed tends to wait until extremes are reached…in either direction…before they act. This was true in 2021 (on the accommodative side)…when they kept the liquidity spigot opened at emergency levels long after the emergency had passed. We believe it will be true again in their current tightening cycle…just like it has been for all tightening cycles since WWII. They’ll tighten for too long…and probably until something “breaks.” However, even if they don’t wait until something breaks, history tells us that they wait until the market has become quite inexpensive.
There is little question that the economy is weakening. We have highlighted many examples this weakness in recent weeks. For instance, the drop in demand for many products like PC’s, iPhones, new and used cars, homes, etc. We’re also seeing signs that companies are significantly slowing their cloud and data spending (which was supposed to stay elevated come hell or high water). We’ve also seen AXP raise their loss reserves in a significant way…and Visa has told us that spending growth has slowed the most since the pandemic…..Yes, the consumer IS still spending…especially on travel and leisure…BUT with credit card debt at all-time highs…and the savings rate back down to their 2008 lows…it’s hard to think that they can keep spending at the same clip going during this holiday season. (Let’s face it, FDX has told us they expect ground shipments to see a significant decline.)
This past week, we got another very important signal that global growth is slowing. The shipping giant, Maersk, reported disappointing earnings. They said that global container demand will be down 2%-4% in 2022 (down from a flat projection). They sighted “dark clouds” that are weighing on consumer purchasing power…and they see 2023 as broadly flat to negative…”with risks skewed to the downside.” Maersk controls 1/6 of the world’s container trade…and with warehouses filling up in the U.S. and around the world, they see just how much the economy is slowing right now.
Of course, some people (in fact, many people) continue to think that if the economy slows further and falls into recession, that will take inflation down in a big way. That, in turn, will allow the Fed to reverse course and start cutting rates and engage in other accommodative policies. The problem with this thinking is that today’s inflation is being fueled by supply issues. We’ve covered this issue a zillion times this year, so we don’t want to belabor the point this weekend. However, we WILL quickly say that if people saw what took place in the 1970s…the last time inflation was supply induced (due the OPEC oil embargo)…they’ll see that a significant slowdown in growth does not cause inflation to subside very much at all in times like these. Instead it gives us stagflation.
Stagflation is a killer for earnings. We have already seen earnings growth predictions for Q4 fall from almost 10% growth in late spring…to a low single digit decline today! This does not bode well for 2023 earnings estimates…which have already fallen 5%. Just think what is going to happen when the rate hikes that the Fed began seven months ago finally start to have their real impact! If we see just a 10% decline in earnings from 2022 to 2023, it will take a decline down to the 3,000-3,200 range just to reach fair value. Since every bear market since WWII has not bottomed until the market fell to an undervalued level (less than 15x…sometimes well below 15x), that 3,000 level (and maybe lower) is a real possibility…..Of course, a 10% drop in earnings would be much better that the average drop in earnings that we see during a recession (the average being -27%), so you can see that we could be too bullish by using a 3,000 to 3,200 range as our target.
This past week, Sam Zell echoed something we’ve been saying since the very beginning of this year. You cannot flood the system with liquidity without consequences. Investors keep trying to have their cake and eat it too. They love the fact that they made all sorts of money through artificial means…when the system had to be flooded with liquidity to prevent a complete shut-down of our financial system. (We are not exaggerating when we say this. The global economy had all but shut down in the spring of 2020. This caused the fixed income markets to freeze up…and we were staring into the abyss in a very similar way that we did in 2008.)…….Investors have loved the party, but they don’t want the hangover. The problem is that they’re going to continue to have a bad hangover for a while…whether they like it or not.
4) Update the charts on the S&P and NDX….For the third week in a row, a nice rally on Friday reversed a very rough day on Thursday…and allowed the market to go into the weekend on a somewhat positive note. This has helped keep investors from panicking over the weekend in recent weeks…..However, as we move past the election, the charts are starting to look quite dicey again.
For the third week in a row, a nice rally on Friday reversed a very rough day on Thursday…and allowed the market to go into the weekend on a somewhat positive note. This has helped keep investors from panicking over the weekend…which should be especially helpful this weekend because a major sell-off on the day before Election Day would be messy. It sure doesn’t look like these late-week rallies have helped the party in power…given that it has been a horrible year for the stock market…but it has helped us avoid some of the extreme declines we’ve seen during other Octobers in the past.
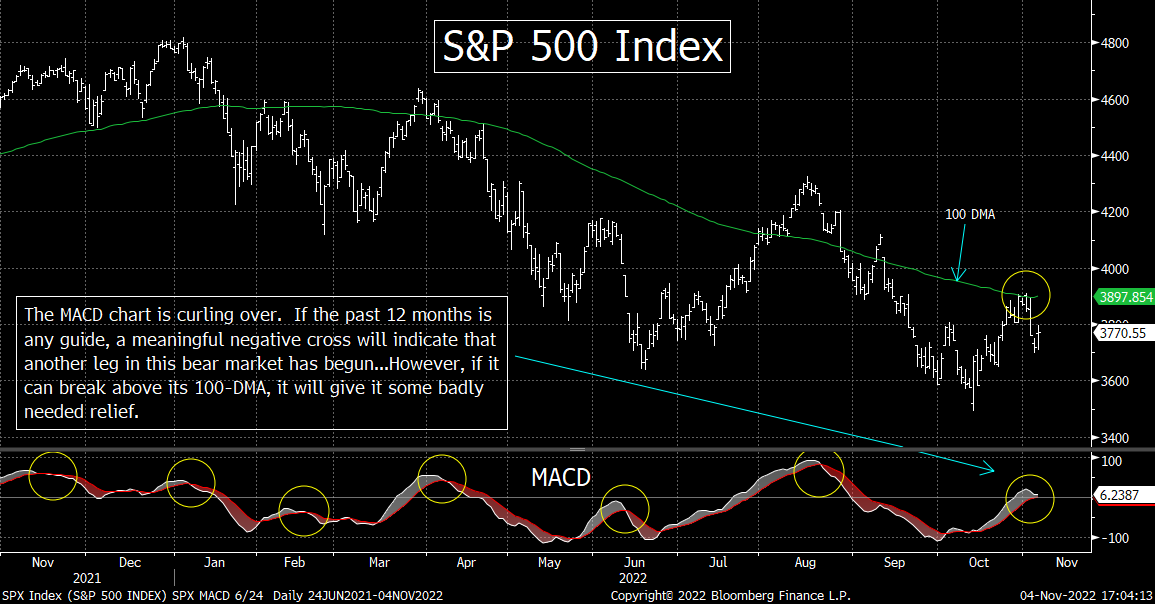
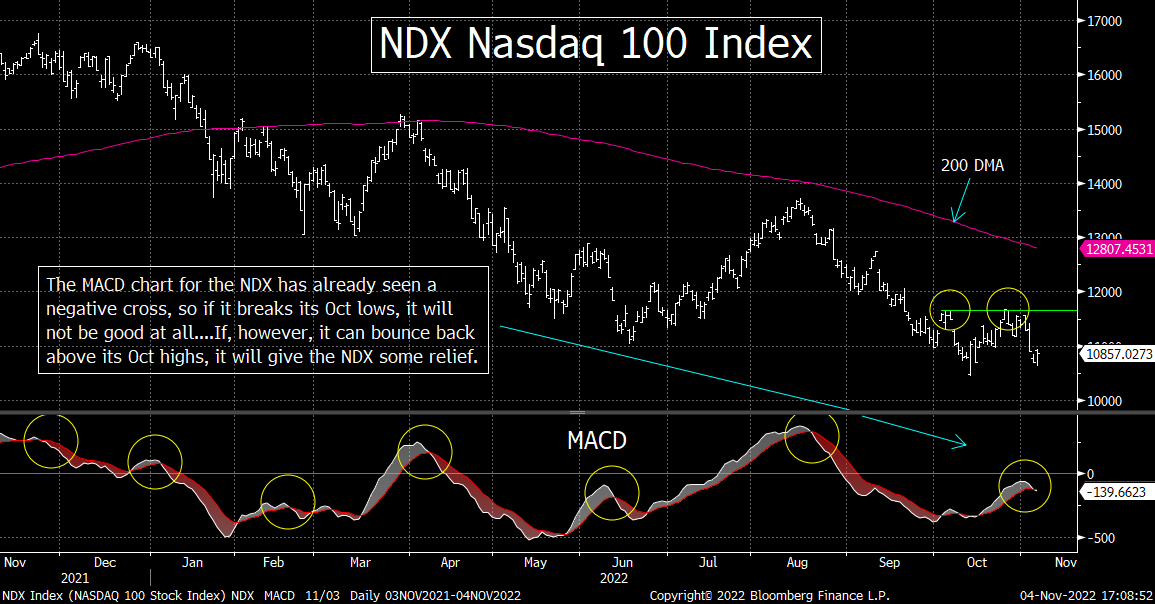
The question now is whether the rally we’ve seen off the October lows is signaling a bottom for this bear market…(or at least a bottom for this year). On the technical side of things, the situation in not particularly encouraging. The MACD chart on the S&P 500 that we highlighted last weekend did curl over further…and is now very close to a negative cross. Also, the MACD chart on the NDX Nasdaq 100 HAS seen a negative cross…albeit a very small one so far. MACD crosses have been very compelling events this year. We highlighted the positive crosses in both indices in early October…and mentioned that they could/should lead to a short-term bounce…that could take the S&P as high as 3,800-3,825. Well, it actually led to a rally all the way to 3,900…so it was a very good indicator a month ago. However, it starting to show a change in trend in the other direction…and it won’t take much of a further decline to give us a clear message that the stock market is headed lower before the year is over.
The S&P 500 is still 5% above its closing low from October 13, but the NDX is just 1.5% above that level. Therefore, it won’t take a lot more downside follow-through for the stock market to give us yet another “lower-low”…in a serious of “lower-highs/lower-lows” we’ve been experiencing all year……..If you’ll remember, we showed last week that the stock market does not do very well in the 4th quarter of a year when we’re in the middle of a bear market…EVEN in midterm election years. Therefore, if we do indeed get some confirmed MACD crosses after we move past election day, it’s going to raise another big red warning flag on the stock market.
On the flip side, if the stock market can regain the upside momentum it garnered in October, we’ll still be watching the 3,900 level as the key resistance level on the S&P 500. That is where the 100-DMA comes in…which has been important for the past year…and provided very tough resistance over four straight days just a week ago. That 3,900 level is also where the 50% retracement of the August/September decline comes in. Therefore, there is little question that if the S&P 500 can break above 3,900 in a significant way, it will give the index some important near-term relief…….As for the NDX, we’re still looking at the 11,700 level as the key short-term resistance level. That’s the level that stopped both the early October bounce AND the late-October rally. So, a move above that level would be bullish…at least on a short-term basis.
In other words, the battle lines are well drawn. If the SPX and NDX can rally above their October highs, in any meaningful way, it could/should be something that helps the bullish case for the stock market…at least for a little while. However, if they break below their October lows…especially their intraday lows from October 13th of 3,490 and 10,440….it’s going to be a VERY bearish development.
5) The Treasury market worked-off some of its oversold condition in late October (overbought condition in terms of yield). However, it still remains quite oversold on an intermediate-term basis (overbought on yield). Therefore, Treasury notes/bonds still remains ripe for a bounce. This might be the one thing that can help the stock market over the last two month…UNLESS the move is a “flight to safety” move.
We highlighted how the Treasury market (in terms of both the 2yr T-note and the 10-year 5-bond) had become extremely oversold in terms of price (overbought in terms of yield) in mid-October. Therefore, we said, it was due for a bounce…and thus a drop in yield. Well, we did indeed see a decline in yields…for about two weeks into the end of last month. Given how extremely overbought the bond yields had become, we were a little surprised that they did not see a bigger decline. However, we still got a meaningful one…and it was enough to work-off some of that short-term overbought condition for Treasury yields. (Since most people look at how the stock market reacts to changes in yield, with stick with that topic for the rest of this bullet point…and avoid talking about Treasury prices.)
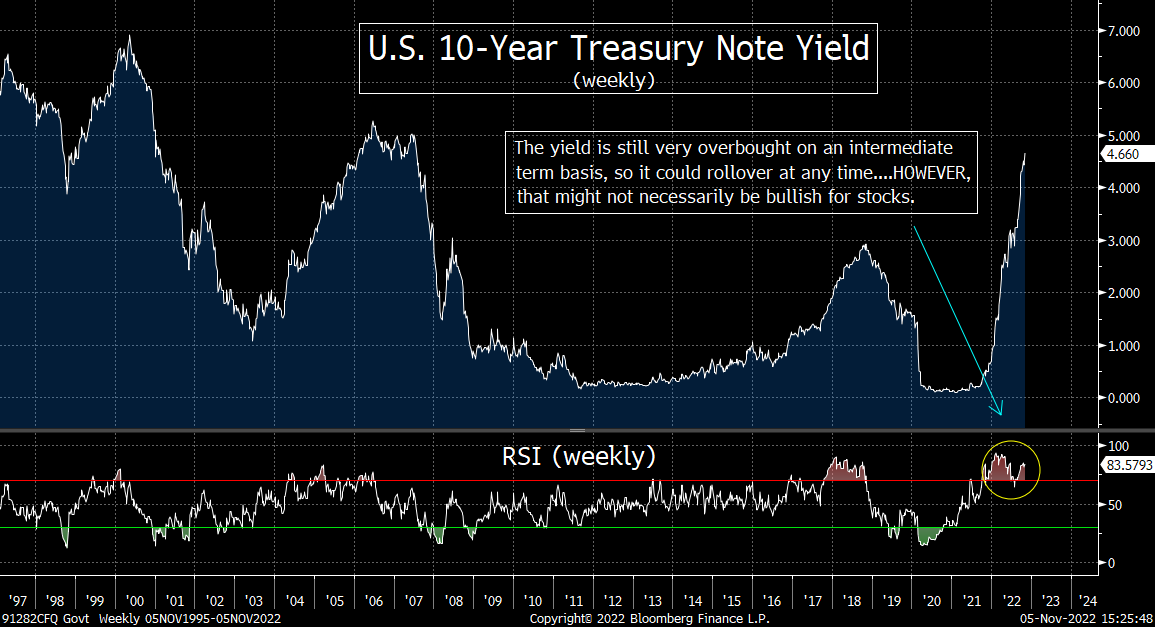
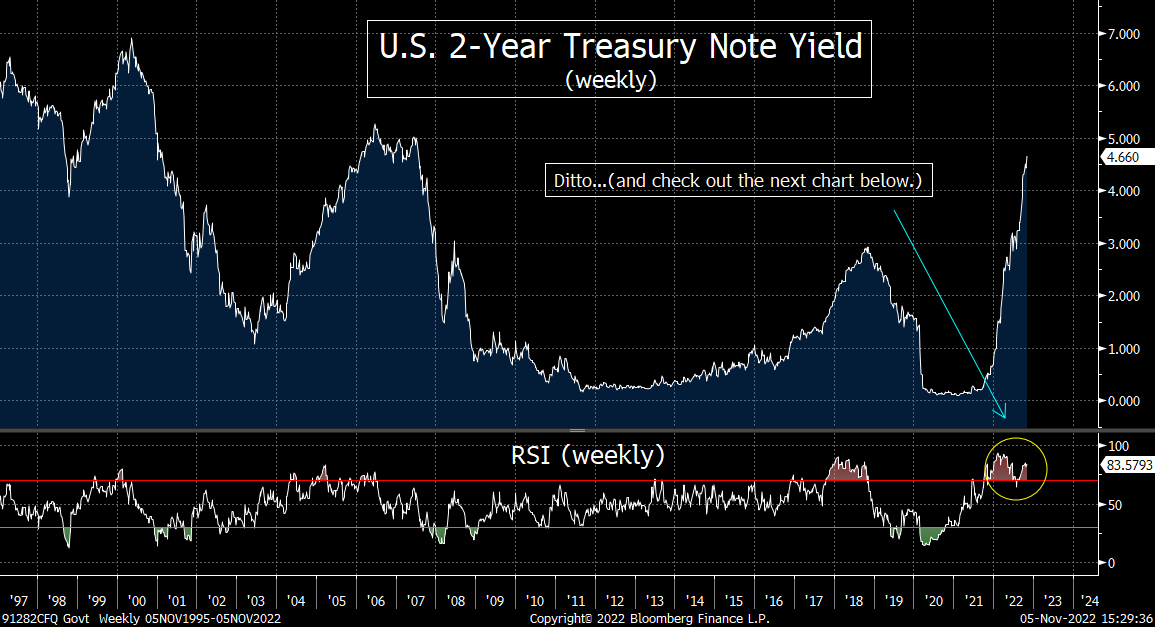
However, the rise in Treasury yields has resumed. This has taken the yield on the 10yr note back above 4% (it close at 4.16% on Friday)…and it took the 2yr yield to a new high for the year (it closed at 4.66% for the week). This has not been enough to take these Treasury yields back into an overbought condition (overbought on yield) on a short-term basis, but yields DO remain overbought on an intermediate term one. In other words, unlike the daily RSI charts on these T-notes, the weekly RSI charts did not work-off their overbought conditions…and therefore, the recent rise in yields have pushed them back down to overbought levels that are close to what we saw 3-4 weeks ago on their weekly charts.
Therefore, they are still poised to decline in yields again before too long. Needless to say, any asset can stay overbought for an extended period of time. Given what the Fed spelled out last week, it would seem unlikely that we’ll see a material decline in yields on a fundamental basis any time soon. However, as we all know, sometimes markets can (and do) move in the opposite direction of what they “should” do on a short-term basis…for technical reasons. Therefore, it is still possible that we’ll see a drop in yields before too long.
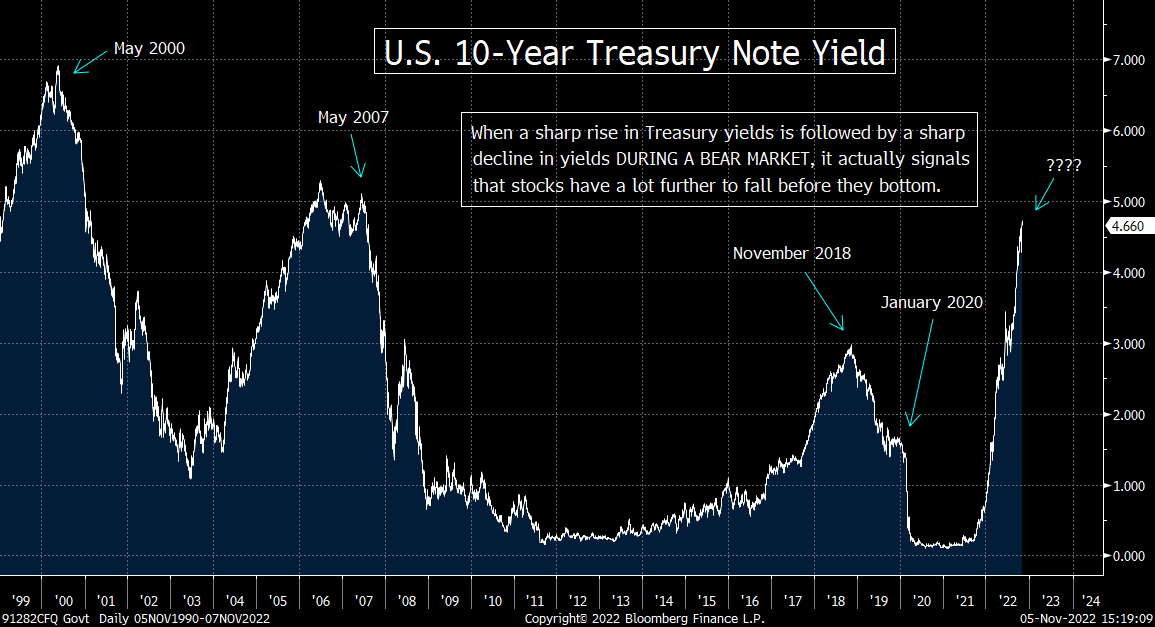
Theoretically, this should be bullish for the stock market. If yields do indeed decline…like they did over the summer and in October…it should help the stock market rally once again. HOWEVER, there is also a chance that any renewed drop in Treasury yields could also correspond to a “flight to safety” move…due to a severe decline in the stock market. ALSO, history tells us that when a sharp rise in bond yields cause a bear market in stocks, a change in trend in those yields from up to down does NOT signal a bottom for the stock market. Just look at the third chart below! Over the past 25 years, a steep rise in yields has caused deep declines in stocks…BUT each time…when those yields do roll back over again…it takes place LONG BEFORE the stock market bottoms.
Of course, a lot of that has to do with a weakening economy…and not just a flight to safety. However, is still shows that when yields START to decline in a bear market, it does NOT signal a bottom for the stock market. In fact, the stock market tends to fall A LOT more…AFTER long-term yields begin to decline again.
This is a long-winded way of saying that we should see a nice bounce in Treasury prices before the year is over, but it might not be the kind of bounce (drop in rates) that will cause the stock market to bounce along with it. In fact, the exact opposite just might take place.
6) As we all know, gold has been a LOUSY hedge against inflation this year. Instead of rallying in the face of the worst bout of inlation in 40 years, it has declined over 20% from March until September. However, the yellow metal has stabilized over the past six weeks and is showing signs of a change in trend. If it breaks meaningfully above one key resistance line, it might finally regain some serious upside momentum.
As it has been for all bulls this year, the gold bugs have had a tough time. However, the big bounce in gold on Friday took it up to a key resistance level. Therefore, if it can rally further next week, it could/should signal that the yellow metal is finally going to see a bounce that lasts for more than just a week to two.
Actually, gold did see a very nice rally at the beginning of the year…into early/mid-March. However, since then, it has seen a steady slide lower…with a series of lower-highs and lower-lows since late winter. This has taken the commodity down by more than 20% at its recent lows, so it has been a rough period for this asset class.
However, we do need to note that gold has been trying to stabilize over the past six weeks. Instead of making a “lower-low,” it has bounced off its September lows on two occasions. In fact, on a closing basis, the low in October was actually a very slight “higher-low.” Therefore, if (repeat, IF) the sharp rally that took place on Friday sees some upside follow-through in the days and weeks ahead, it will be quite bullish for gold!
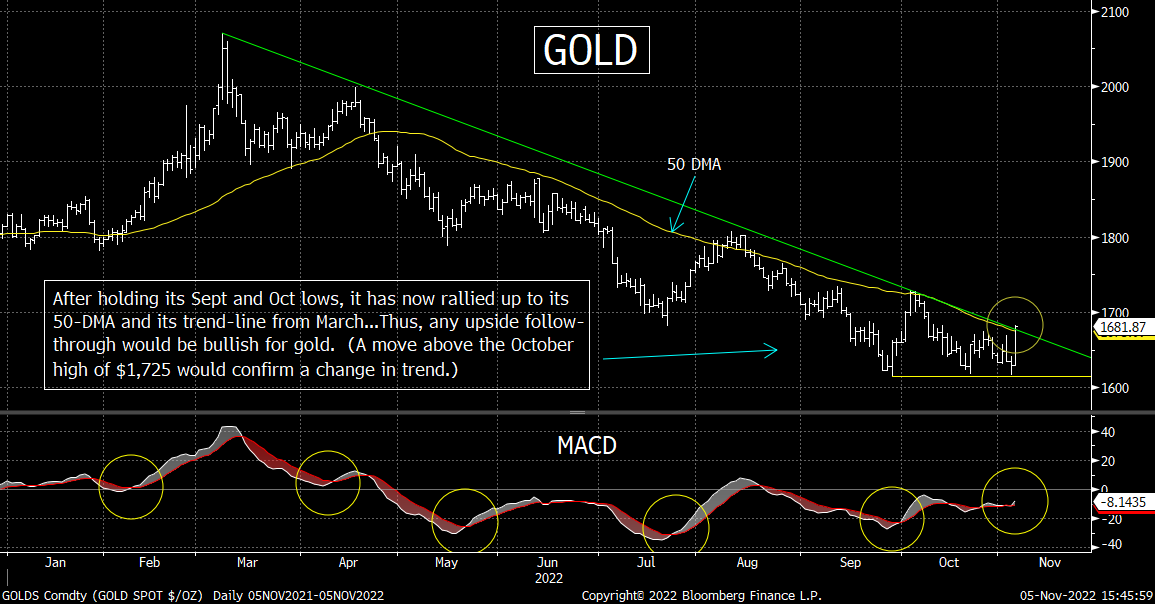
The first thing we’re watching is the 50-DMA on the yellow metal. This moving average has provided very tough resistance over the past six months. It got right up to that line in June, August, September and October…and rolled right back over. (Actually, it got above that line in August, but only in a very, very slight way…and then rolled back over.) Friday’s rally took it slightly above the 50-DMA once again. Therefore, if it can finally move above that moving average in a significant way, it will be quite bullish for the commodity. This will be especially true given that the 50-DMA is where the trend-line from March comes in as well!
We do admit, however, that we’d want to see gold follow its recent “higher-low” with a “higher-high.” It will take a move above $1,725 to achieve that goal. However, you have to start somewhere…and so, even if we won’t get confirmation of a change in trend until gold moves above $1,725…a above $1,700 would be a great start……...Of course, we HAVE to wait to see if this kind of upside follow-through actually takes place, but a move above that round number will certainly have us prepare a green flag for the commodity. Once it rises above $1,725, we’ll raise that green flag to the top of the flag pole VERY quickly.
6a) We also want to highlight that Ethereum is finally seeing some daylight. If it rallies a bit more over the near-term is just might signal that it’s going to see a year-end rally.
As we all learned many months ago, the cryptocurrencies have been a horrible hedge against inflation…despite what many had hoped going into this year. At their worst levels, Bitcoin was down almost 75%...and Ethereum stood more than 80% below its own 2021 highs. Both have been dead money since June…and Bitcoin remains stuck in a sideways range. However, Ethereum is starting to show some signs of life. Belief or not, even though Ethereum still stands 65% below its 2021 all-time highs, it has actually rallied 81% off its June lows!
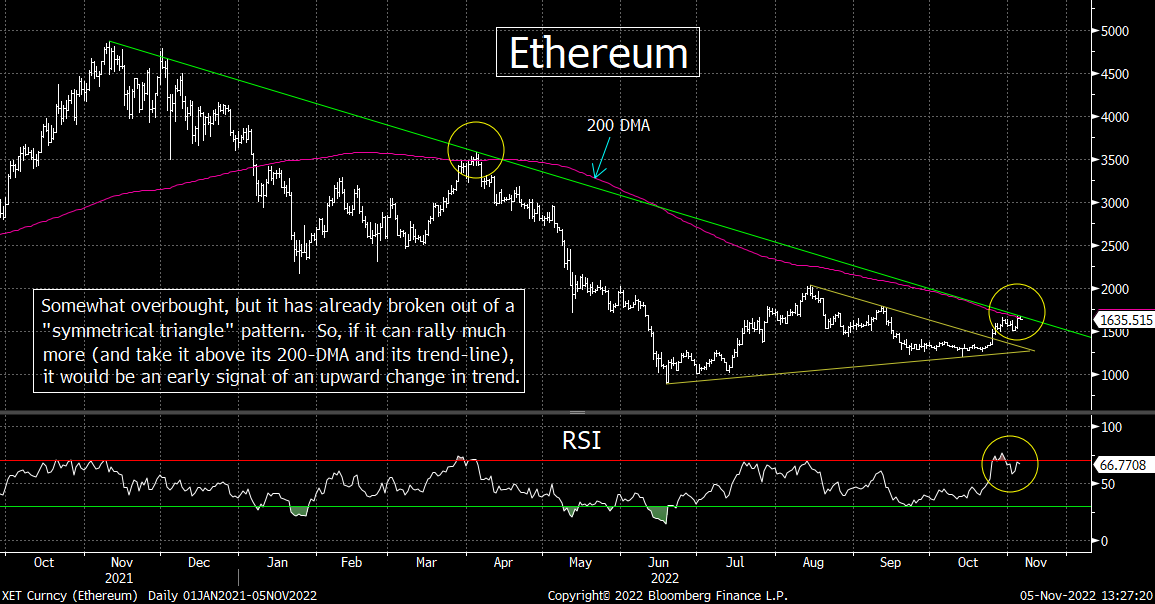
This has take rally has helped ETH break above a “symmetrical triangle” pattern…and it is now testing a two other key resistance levels. The 200-DMA of $1,655 is also where the trend-line going back to the November 2021 highs comes-in. That 200-DMA provided VERY tough resistance back in April, so if Ethereum can break above that level in any meaningful way, it will be quite bullish on two more levels……We must admit, we’d like to see it break above $2000 (its April highs) to get confirmation of a change in trend, but any material upside follow-through in Ethereum over the coming days/weeks would be quite bullish for this particular cryptocurrency.
Of course, the cryptos…including Ethereum…have been seen as liquidity plays. Therefore, an upside breakout would not go along very well with our overall bearish opinion on risk assets right now. However, maybe Ethereum is finally going to become an inflation hedge…or maybe it is about to become the breakout crypto that many people believe it will be. (Let’s face it, it has a lot more uses than Bitcoin.)…..OR, if (repeat, IF) Ethereum does indeed breakout, it might just be a bullish signal for other asset classes as well. Just because something does not fit our overall opinion…does not mean it is something we shouldn’t highlight…..No matter how you slice it, IF Ethereum breaks above $1,755, it’s going to be bullish on a technical basis…and if it breaks above $2,000 in any meaningful way going forward, it’s going to confirm an important change in trend.
7) Despite all of the recent news about Credit Suisse…and some chatter about problems at other European banks…this group on th e other side of the pond has seen a very nice rally over the past month. The STOXX 600 Europe Banks index is testing a key resistance level, so there is a chance it could rally further…….However, it is also getting overbought. Given the economic backdrop in Europe right now, we think the shares of these banks should be avoided.
Believe it or not, the European bank stocks have acted quite well in recent weeks. The STOXX 600 Europe Banks Index has rallied 14%...and it is now testing its highs from both August and September…as well as its 200-DMA. We’d also note that despite the concerns about the European economy, this index did not fall much below its March lows as we moved through the spring, summer, and early fall months. This is a big difference from what the U.S. banks have done…as the KBE bank ETF fell 16% below its March lows this summer…and still stands 6% below those lows.
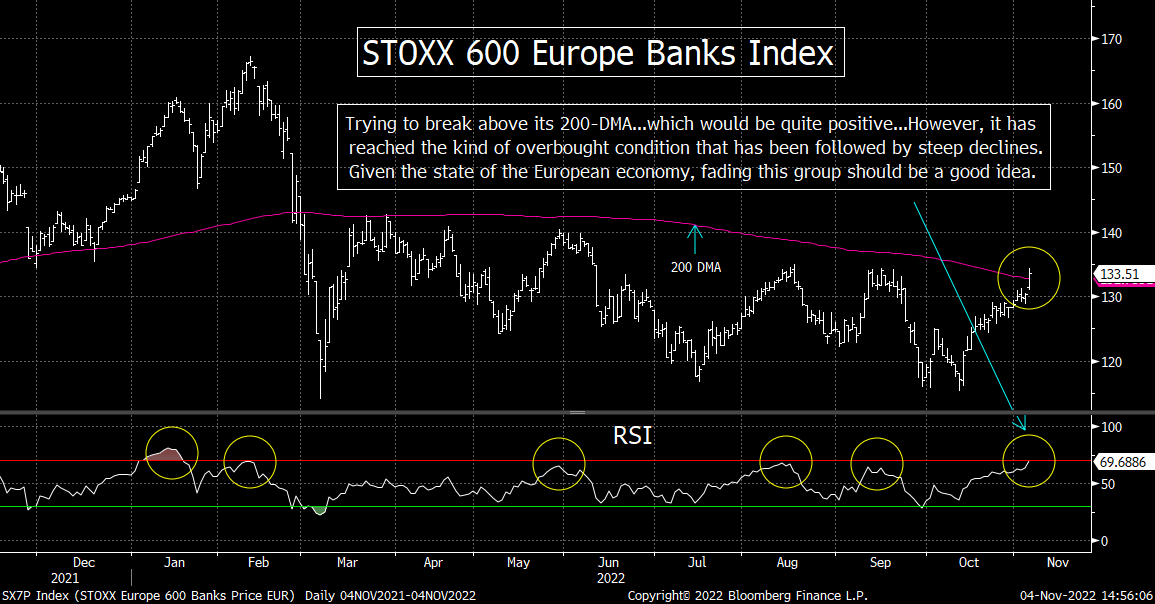
We readily admit that this data is a bit misleading. The March lows were much worse for the European banks than it was for the U.S. banks…as the March lows were 27% below the January highs for the European banks…and “only” 15% lower for the KBE. However, it is very interesting to note that they both stand 20% below their January highs right now! This is quite strange to us because the U.S. economy is holding up much better than the European economy…and we have not heard any chatter about any U.S. banks…like we have about Credit Suisse! Therefore, we’re thinking that the European banks are well ahead of themselves on a short-term basis…and given that the STOXX 600 Banks Index has reached the kind of overbought level on its RSI chart that has signaled tops several times in the last year, we think investors who own these names should think about lightening up on them as we move into the month of November…and potential new buyers should avoid them.
No, we are not calling for a big problem to erupt at Credit Suisse or any other European banks in the near future. We’re just saying that they should not be acting as well as the U.S. banks…and since they are, investors should consider lightening up on them…now that they’ve become overbought on a technical basis.
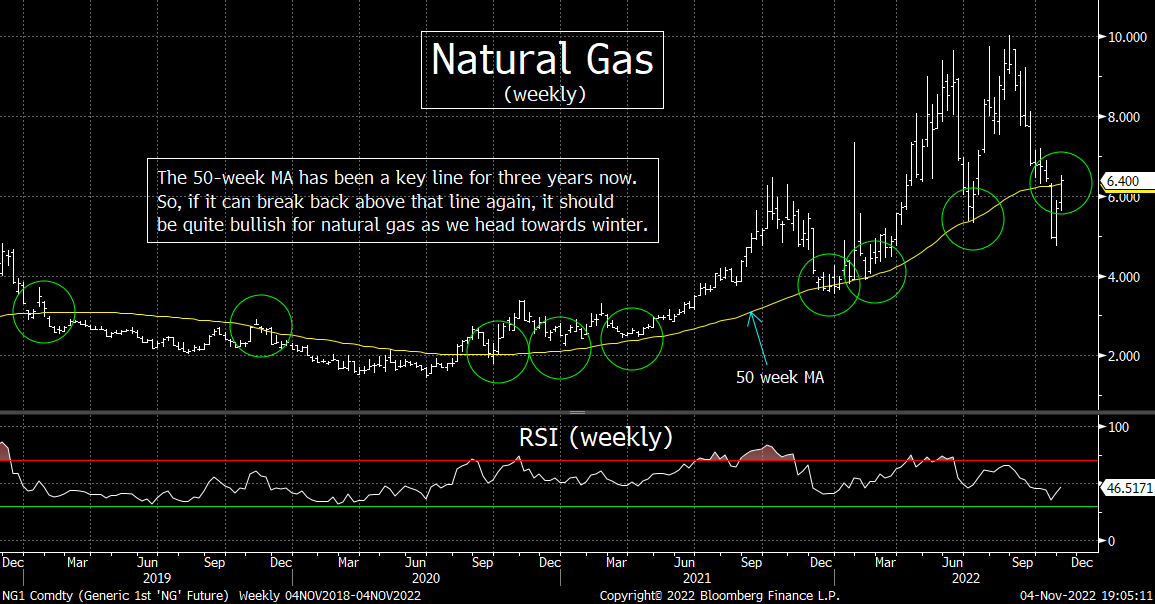
8) A lot has been made about the decline in natural gas over the past two months, but as we head towards the winter months, it has started to rise once again. Look at the chart on natural gas, there are reasons to think it will rise much further once again. This, in turn, should be bullish for the energy stocks with a lot of exposure to area of the energy industry.
It has been a very interesting year for natural gas…to say the least. After a huge rally of 160% from the beginning of the year into early June (fueled by the Russian invasion of Ukraine…and the sanctions that followed), the commodity plummeted 40% in less that four weeks! It then bounce again…rising 78%, to a higher-high above those June highs. Once again, this was followed by another outsized decline. This time, it was a drop of 48% into late October. However, since October 21st, natural gas has bounce strongly once again. It has jumped almost 30%...and it looks poised to rally further……Wow!
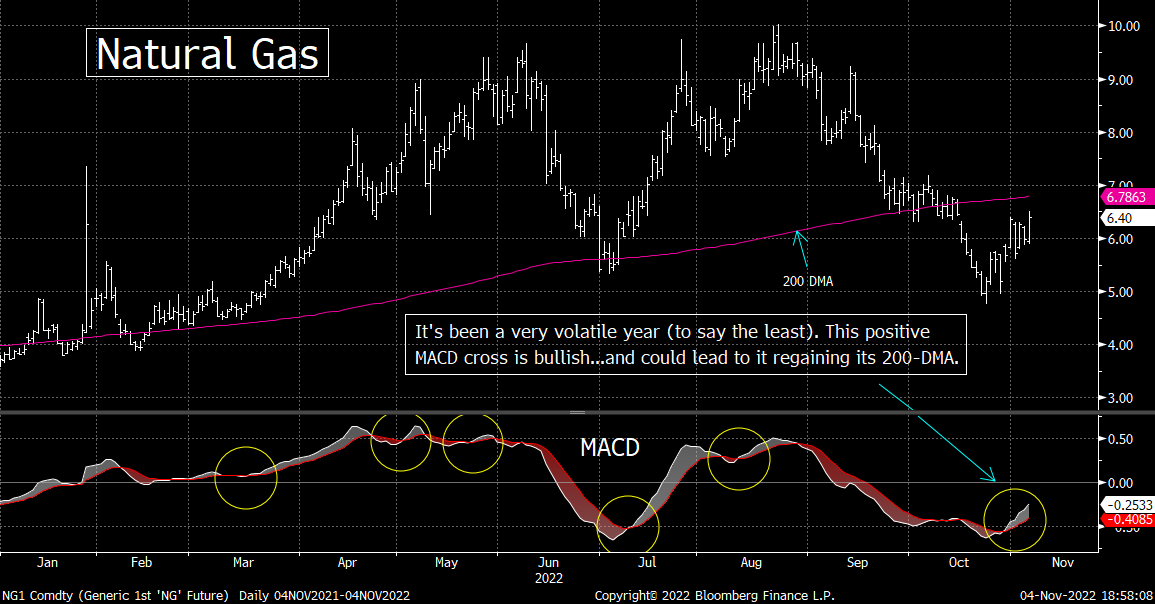
Right now, we’re looking at two charts on natural gas. The first one is the MACD chart. It is very close to a positive cross…and when previous crosses became meaningful ones this year (just like it has recently), it has been followed by nice (further) upside momentum. We’re also watching the 50-week moving average on the commodity. If you look at the second chart below, you can see that the 50-week MA for natural gas has been quite important over the past three years. For almost a full year between late 2019 and the fall of 2020, the 50-week MA provided very tough resistance for Nattie Gas. Then once it broke above that line in Q4 of 2020, this moving average provided rock-solid support a half dozen times over the next two years…as “old resistance” became “new support.”
However, it broke below that line just over a month ago…and fell more than 20% below it at one point early in October. That said, its recent sharp bounce has taken it back up to this “new resistance” level once again. Therefore, if it can break above that line in any meaningful way, it should be very bullish for the commodity…especially since its MACD chart has seen a very nice positive cross recently.
Of course, the movement in natural gas as we move into the winter months will depend greatly on the temperatures in Europe and around the globe…as well as the geopolitical situation in Eastern Europe. However, the charts sure seem to be telling us that the bounce that started two weeks ago in nat gas is going to be another big one…just like the previous two bounces we have already seen this year.
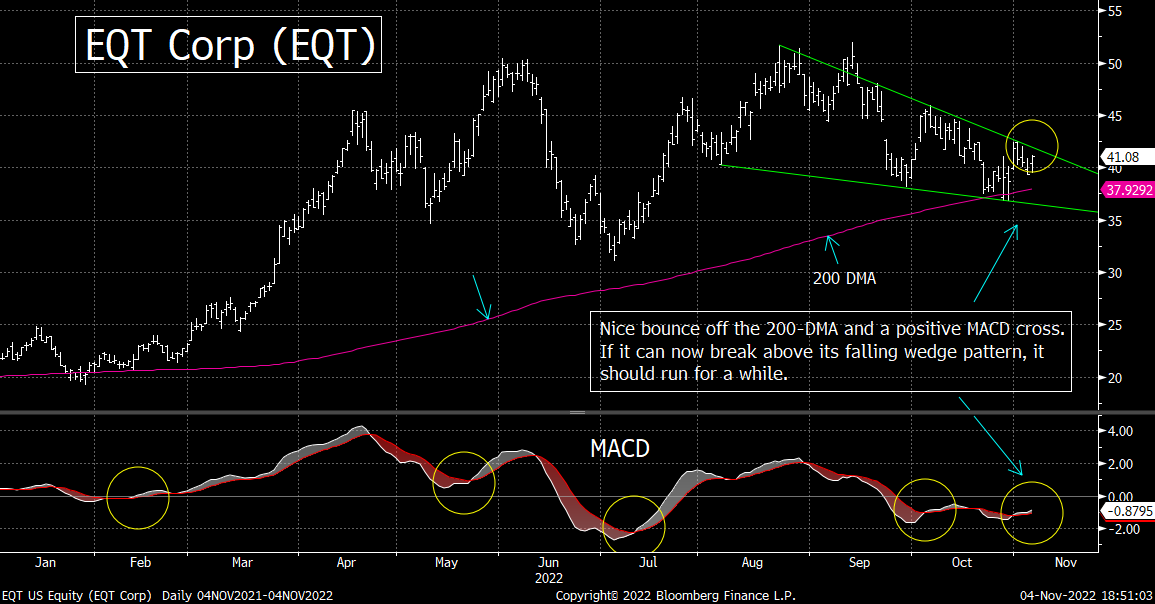
If this is indeed the case, the stocks that are in that business…and are thus highly correlated to the price of natural gas…should do quite well. Looking at the chart on EQT Corp (EQT), it looks very, very interesting. The stock was able to bounce off its 200-DMA recently…and it has just seen a positive MACD cross. This “cross” is only a very mild one so far, but if the stock rallies further, it should become a much more prominent MACD cross…which should bode well for EQT if the past year is any guide. On top of this, EQT has formed a declining bullish wedge pattern. Therefore, any break further rally would not only give it a positive MACD cross for EQT, but it would also break out of this wedge pattern in a bullish manner!
With all of this in mind, we’ll keep a very close eye on natural gas…and its underlying stocks…very closely over the next week or two. If they can rally much further, it should be a signal that their momentum has changed solidly back to the bullish side of things…and that the group should do very well into the end of the year…and through much of the early months of 2023.
9) Midterm Election…….By Matthew J. Maley Jr…….Making predictions in politics is the fastest way to undermine one’s credibility, but the pendulum is still swinging in the GOP’s favor with just hours until Election Day. If nothing else, I’m confident that the Republican party will control both chambers of Congress on November 10th. The question will be if it gives them a mandate or not…and a few key states will give us that answer.
Hello all – I’ll have to make my remarks brief today. Polls will open in just about 36 hours, AND my wife and I are celebrating our first wedding anniversary. I’m not sure who is expecting more today, my boss or my beautiful bride.
Anyway, the finish line is finally within sight. In about 72 hours we’ll have MOST of the 2022 election results, and the biennial reshuffle of Washington will begin. There are likely to be a few outstanding races yet to be called as most observers go to bed on Election Night. Pennsylvania’s voting rules mean that late ballots will still be counted well into November 9th in what will feel like a repeat of the 2020 results.
Georgia is also slated for 2020 déjà vu as polls indicate neither candidate will earn more than 50% of the vote, triggering a runoff election. This would be a nightmare scenario for Georgia voters who were pleading for mercy in 2020, when the full might of both political parties fell upon the state.
Many experts agree that Republicans are well positioned to flip both chambers of Congress. However, while Pelosi is all but guaranteed to give up the Speaker’s gavel, the race for U.S. Senate is more contentious. The recent flood of polls indicate that Republicans are about to sweep the nation in a historic red wave. States like New Hampshire and Washington are suddenly competitive. However, I’ve developed a healthy skepticism of polling data since the surprise results of 2016. Many of the most recent polls were conducted by companies known to have a conservative skew. The same phenomenon from left-leaning firms contributed to the nation’s shock in 2016. Nonetheless, I’m comfortable making some predictions about the outcome of key Senate races.
Previously competitive races in North Carolina, Florida, and Iowa are now considered safe for Republicans. This leaves the GOP with 47 safe seats to the Democrat’s 45. Of the remaining eight races, it’s almost certain that Republicans Ron Johnson of Wisconsin and J.D. Vance of Ohio will emerge victorious.
That leaves Democrats with six competitive races on election night, all of which they must win to get an outright majority and five of which are currently held by Democrats. Of those races, I’m most comfortable saying that Washington state and New Hampshire will remain in Democrat hands. Although the momentum is firmly on the GOP’s side, I believe that enough of the Democrat base will turn out to stave off losses there. However, if Republicans win either of these races, it could mean an all-out wipeout for Democrats in the remaining four races. With the NH results hitting the airwaves early on Tuesday night, this is going to be a key one to watch when the polls close.
The most likely state to flip on election night is Nevada. Challenger Adam Laxalt consistently leads incumbent Senator Catherine Cortez Masto in poll after poll. Although Masto has served with distinction and is generally popular, her embrace of Joe Biden’s agenda in the country’s current economic climate, may have Nevada voters looking for a fresh face. If Laxalt wins, Republicans will hold 50 seats.
The remaining three races will decide control of the U.S. Senate for the next two years. Although it’s conceivable that Democrats will win some of these races, it’s unlikely they will win all three. I’m most confident in my opinion about Pennsylvania…where I expect Dr. Oz to replace retiring Senator Pat Toomey. Oz’s opponent, John Fetterman, was favored to win this race before his truly disastrous performance on the debate stage last month. Pennsylvanians may still see Oz as an outsider, but Fetterman’s debate performance has left many wondering if his recent stroke has impaired his ability to lead. Voters want their elected officials running the show, not their staff.
Oz’s victory will likely be announced sometime on November 9th. However, Republicans may have already secured a majority if Blake Masters emerges victorious in Arizona. Arizona and Georgia will be the closest races of 2020. All I’m comfortable predicting here is that Georgia will go to a runoff on December 6th. Arizona will be the final bellwether of this election. If Democratic Senator Mark Kelly wins, the massive red wave that Republican strategists predicted may just be an ebbing tide that floats them to just a small mandate.
Making predictions in politics is the fastest way to undermine one’s credibility, but the pendulum is still swinging in the GOP’s favor with just hours until Election Day. If nothing else, I’m confident that the Republican party will control both chambers of Congress on November 10th. Please stayed tuned for my final regular piece next week…when I spike the football on my predictions!
(Matt Maley Jr. has worked for elected officials on both sides of the aisle…including a U.S. Senator, a Member of the House of Representatives, and a Governor of a very large state. You’re not going to find a more even-handed person in Washington D.C.)
10) Summary of our current stance……….We keep hearing that the Fed is wrong. Many people believe the Fed was wrong about inflation a year ago…and now their wrong about it (in the other direction) once again. However, for us…as strategists…it matters less to us whether they’re wrong or not. It’s what they believe…and they are going to continue to keep monetary conditions tight going forward. Thus, although we understand why people continue to be critical of the Fed…because they want to impact the Fed’s policy…we’re surprised that they use that criticism to predict what is going to happen in the markets going forward. When we’re thinking about what is going to happen in the future, we strongly believe that we need to concentrate on what the Fed is doing…and is going to do in the future…and not on what we think they “should” do.
We totally agree that the Fed kept the liquidity spigots open much too long in 2021…and it’s something we said ad nauseam in the summer/fall of 2021. However, even though they were wrong in keeping monetary policy extremely loose in 2021, they still kept the liquidity spigot wide open…and it caused the stock market (and other risk assets) to continue to rally in a significant way. This time around, even IF the Fed is wrong, it sure looks like they’re going to keep conditions tight for some time into the future. Therefore, whether it’s wrong or right doesn’t matter as much to us. We care about the realities that exist today…and we want to act accordingly…….Put another way, we think that betting that the market will rally in a big way in the months ahead…just because one believes that the Fed “should” change their policy…makes zero sense.
However, we also believe that it is important to move some of our focus away from the Fed…and towards what is going on in the economy. The Fed started raising rates seven months ago, so it’s just now starting to have an impact on most areas of the economy. (Sure, it hurt some areas sooner than this, but we all know they is always a lag in the impact of a change in Fed policy on the economy.) Since the Fed has signaled that they’re not even close to “pausing”…and that they’ll keep rates elevated for quite some time…the odds are quite high that we’re headed for something much worse than a soft landing…and if history is any guide, that should include a material decline in earnings. In other words, even if the Fed stops raising rates by the end of Q2 2022, the damage will have been done. Since the stock market is not particularly close to reaching an undervalued level (especially if we get negative earnings growth…like we always do in a recession)…and every bear market since WWII had not bottomed until it has reached an undervalued level…we think the stock market has much further to fall before this bear market comes to an end.
As Sam Zell said last week…and as we (and others) have been saying all year. You can’t flood the system with liquidity without consequence. Despite the fact that many people want to have their cake and eat it too…(many of whom believe they DESERVE to be able to have it and eat it too)…it’s not possible……..We were ALWAYS going to have to come off the steroids…and it was ALWAYS going to be very painful…..Investors did not fight the Fed on the way up…so why are so many of them fighting the Fed today? It doesn’t make any sense.
Matthew J. Maley
Founder, The Maley Report
TheMaleyReport.com
matthewjmaley@gmail.com
Although the information contained in this report (not including disclosures contained herein) has been obtained from sources we believe to be reliable, the accuracy and completeness of such information and the opinions expressed herein cannot be guaranteed. This report is for informational purposes only and under no circumstances is it to be construed as an offer to sell, or a solicitation to buy, any security. Any recommendation contained in this report may not be appropriate for all investors. Trading options is not suitable for all investors and may involve risk of loss. Additional information is available upon request.