
Some Cracks are Showing Up in the Small Cap Rally
- The decline in the stock market yesterday was led by a drop in the big-cap tech names. However, this recent decline has not been isolated to the tech arena. We’re also seeing some cracks in the small-cap Russell 2000 index…..It’s WAY too early to raise any big warning flags on these developments, but it’s something to keep a very close eye on in the days and weeks ahead.
The stock market had a rough start to the year…with the NDX Nasdaq 100 leading the way lower with a 1.6% decline. However, after a huge rally over the last two months of 2023, yesterday’s action was not something that sent shivers up anybody’s spine. We’d also note that the S&P 500 and Russell 2000 did not fall as much as the NDX…with drops of 0.57% and 0.70% respectively. We’d also note that although the breadth was 3 to 1 negative for the NDX, it was only mildly negative for the Russell…and it was actually positive for the SPX!
If there was one thing that did stand out on the negative side of things in terms of the “internals” from yesterday, it was that the volume did jump in a meaningful way. In fact, if you don’t include the big “quadruple witch” expiration day of December 15, the volume for the SPY (S&P 500 ETF) and QQQ (NDX Nasdaq 100 ETF) was higher than all but two days in the entire 4th quarter! So, there WAS at least SOME selling going on yesterday.
If there was one other item besides the big jump in volume we saw yesterday that was concerning was the change in action in the Russell 2000. During the morning hours, the small-cap Russell was outperforming the S&P 500 quite handily. However, after a sharp 1% decline in the afternoon, it underperformed the SPX by the end of the day. In other words, although we DID see some “rotation” in the morning hours…out of big tech and into the small-cap arena, BUT the selling became broader based in the afternoon. Thankfully, the market was able to bounce a bit in the last half hour of trading, but the stock market still finished the day in the red.
Speaking of intraday reversals, crude oil’s early morning hours (in response to the rising tensions in the Middle East) reversed in a significant way…and took the commodity down by over 4% from its morning highs. This decline has taken WTI crude oil back down to its 200-week moving average. As we have been highlighting for quite some time, the 200-week MA has been critical support for WTI since March of last year. Yes, it has broken slightly below that line several times, but it has been able to bounce back quite strongly each time. Therefore, if (repeat, IF) it does break below that moving average in any significant way over the coming days/weeks, it will be quite negative on a technical basis. Therefore, we will continue to keep an extremely close eye on this commodity going forward.
Another issue that we’ve been harping on for months has been the impact that an increase in liquidity has had on the markets since regional banking crisis. This topic seems to be finally getting more attention around Wall Street, so it’s something we’ll continue to harp on going forward…….We’d also note that the dollar has seen a sharp bounce over the past few trading days, so our bullish short-term call on the greenback has turned out to be quite prescient as well.
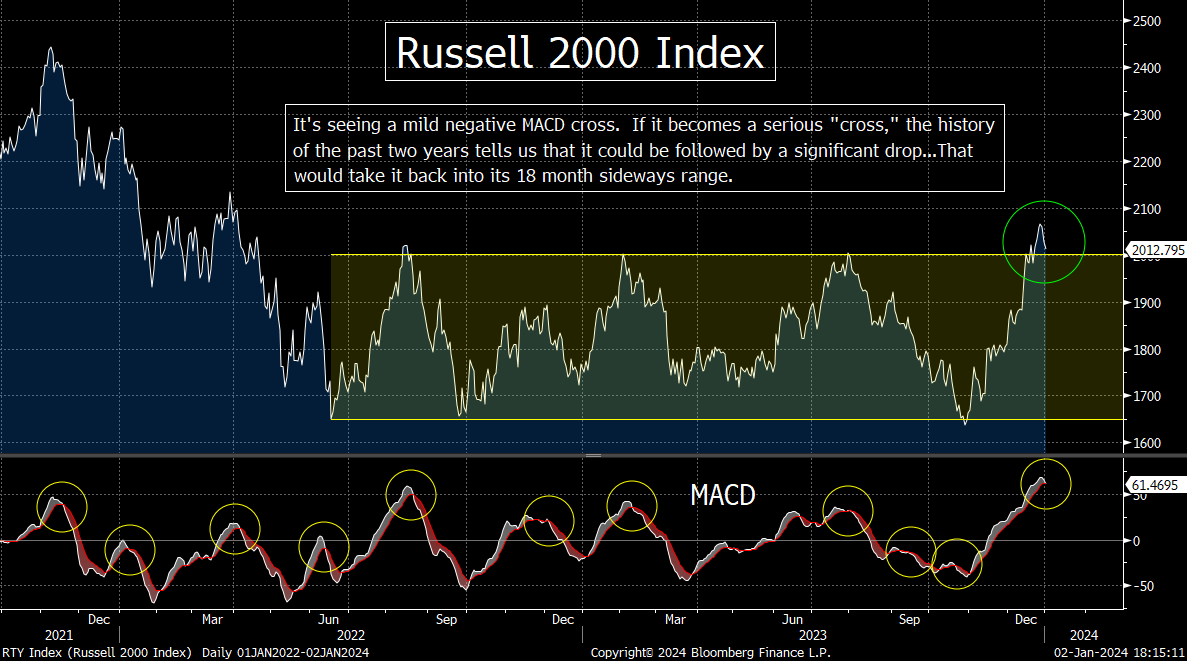
Okay, now that we’ve dislocated out shoulder patting ourselves on the back, we want to go back to the action of the Russell 2000 Index. It’s recent 3-day decline of 2.6% is not big enough cause investors to change their habits. (That would be like expecting a billionaire NFL owner to change their habits if they were fined the equivalent of a parking ticket.) However, we do need to point out that this decline has been enough to create a negative MACD cross on this small-cap index. This negative cross is only a very, very slight one so far, thus we don’t want to make too much of this development quite yet. It’s going to have to become a much larger “cross” before it becomes a compelling development. However, it’s definitely something we will need to keep a very close eye on over the coming days and weeks.
If you look at the chart below, confirmed negative MACD crosses over the past two years have been followed by meaningful declines in this small cap index on many occasions. (Some of the declines have been rather significant ones. In fact, five of them have been between 15% and 22%!) Therefore, if (repeat, IF) this recent weakness becomes more pronounced, it’s going to raise some big yellow warning flags before long.
Again, this is a big “if”….The Russell recent broke out of a (rather wide) sideways range that it has been in for over 18 months. This is quite positive, so if the present little dip we’re seeing is something that ends soon…and the rally we’ve seen since late October reasserts itself…and pulls the Russell further away from its sideways range…it’s going to be extremely bullish. However, if it falls back well within that old range over the coming days/weeks, it will take a lot of wind out of the sails of those who have been thinking that a big rebound in the small cap stocks will help the rally of 2023 broaden out in a substantial manner.
In other words, even though the big-cap tech names are getting most of the blame from yesterday’s drop in the stock market, it is important to note that another key sector within the marketplace is seeing some cracks as well. So far, they’re only small cracks. However, this situation highlights what we’ve been saying about the stock market in general over the past week or two: The market stands at a critical juncture on the technical side of things…and how it acts as we move through the first several weeks of 2024 is going to be very important for how it acts throughout the entire first half of the year.
Matthew J. Maley
Founder, The Maley Report
TheMaleyReport.com
matthewjmaley@gmail.com
Although the information contained in this report (not including disclosures contained herein) has been obtained from sources we believe to be reliable, the accuracy and completeness of such information and the opinions expressed herein cannot be guaranteed. This report is for informational purposes only and under no circumstances is it to be construed as an offer to sell, or a solicitation to buy, any security. Any recommendation contained in this report may not be appropriate for all investors. Trading options is not suitable for all investors and may involve risk of loss. Additional information is available upon request.