
Lower Inflation Does Not = the Return of "Free Money"
With the Thanksgiving holiday this coming week, the second half of the trading week should be quite uneventful. With this in mind, we will not be sending out a weekend piece next weekend. However, if we get some sort of surprising development(s) in the coming days, we WILL publish an abbreviated piece next Saturday. That said, it is more likely that we will not be sending anything out next weekend. In other words, next week, we’ll keep the comments to our “Morning Comment” from Monday-Wednesday. Thank you…and have a great holiday week!
Table of Contents:
1) Is the stock market misinterpreting the decline in inflation?
2) Bonds breaking key technical levels. It’s not very far from another one.
3) The action in the high yield market is very encouraging for the bulls.
4) The tech sector is getting quite overbought on a near-term basis.
5) Nvidia stands at a crucial technical juncture…with earnings coming out on Tuesday.
6) Update on the charts of the major averages. (SPX & NDX are getting overbought.)
7) Crude oil & energy stocks might see one more dip, but they look enticing.
8) Banks: This is not like the rebound we saw in the early/mid 1990s.
9) The leadership in Israel sure seems to be quite adamant.
9a) Finally, a change in the rhetoric on an important issue.
10) Summary of our current stance.
1) The quality of the recent stock market rally continues to be very good. It’s getting extended, but it’s still an impressive rally. However, eventually, the stock market is going to realize that a decline in inflation does not mean that the era of “free money” has returned. Without free money, the stock market cannot maintain today’s high valuation levels.
The rally in the stock market has been a tremendous one over the past three weeks. It has taken the S&P 500 and the NDX Nasdaq 100 above several key resistance levels…and it has also come on good breadth and volume. So, the “internals” have been the kind that have eventually been followed by further upside movement in the past. (When it comes to breadth, we do admit that the S&P 500 Equal Weight Index has underperformed the regular S&P 500 index, but nowhere near to the degree it did during the big rally we saw this spring and summer. It has rallied, 8.6% vs. 9.6% for the SPX, so that’s much better than the 12% vs 19% gains we saw at the mid-summer highs.)
This action does not guarantee anything, however, and no market moves in a straight line. In fact, it would actually be normal and healthy if the stock market saw some sort of pullback soon…or at least a sideways breather...before it moves higher. If the market keeps rallying in a relatively straight line, that will likely mean that the upside potential for this rally will not be as high as it would be if it took the time to digest some of its gains a few times along the way.
However, we are still not convinced that this recent advance will definitely see another big leg before the end of the year. One of the key reasons behind our skepticism surrounds the state of the market when it bottomed in October. Several important items were missing…that we usually see at an important bottom. First of all, we did not see a big capitulation move in October. This issue is not as concerning as the other issues we will cover, but it’s still something to consider. Markets do not always see a washout move when it makes an important bottom, but it IS something that we frequently DO see at key lows. (The main reason for this is that a washout move tends to signal that a lot of leverage has finally been unwound.)
The more important issues that concern us have to do with valuations…which is something we’ve been harping on for a long time. As we just said, whenever we see a big rally off a low…that includes strong volume and good breadth…after a capitulation move…its advance almost always lasts for a very long time. That said, we’d also note that when this scenario plays out, it also usually includes the market becoming cheap at the low…before it begins a lengthy advance. That did not happen during the 3-month decline that ended in October.
Over the past 25 years, all of the important bottoms were made after the stock market had become quite cheap. This was true for the bottoms that were reached after big declines that included major “washout” moves (like in 2003, 2009, and 2020)…as well as ones that did not see a big capitulation at the bottom (like 2011, 2016, and 2018). However, ALL of those bottoms were formed AFTER the S&P 500 had fallen to a level between 9.8x and 15.8x earnings…and between 0.7x and 1.5x sales. Three weeks ago, the bottom entailed a drop to just 18x earnings and 2.2x sales.
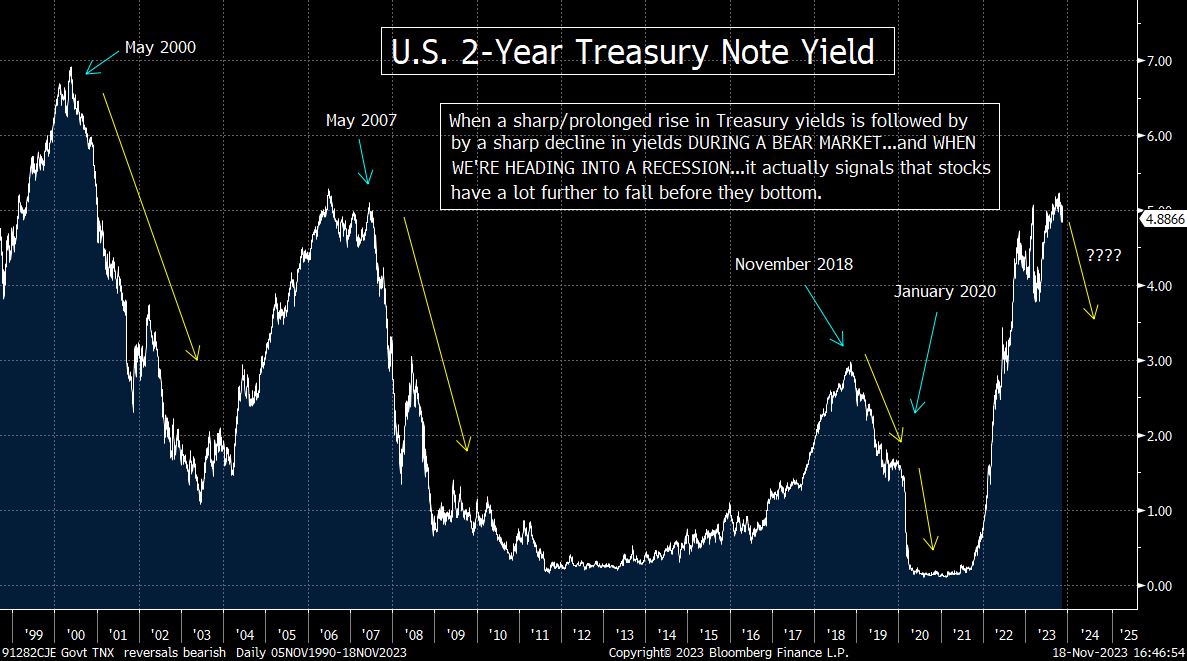
On top of all this, each one of the most important bottoms of the past 25 years has come after bond yields had fallen in a major way…and after those yields dropped below a multi-year trend-line. This goes back to the theme we have been harping on for many, many months. We’re talking about the one that says whenever bond yields rise in a serious manner over a long period of time…and then they reverse and decline in a significant way…it is always followed by a deep correction (at least) in the stock market. In other words, the bottom does not come for the stock market when interest rates/bond yields top out…or shortly after they top out. The bottom comes after they have fallen in a dramatic fashion (and much more than they’ve dropped recently).
In other words, when rates/yields rise in a major way, it either breaks something or causes a recession (or both). Therefore, we have to see a large drop in rates/yields so that the stock market can correctly reflect the problems in the economy and/or the system. Put another way, at some point after the initial decline in rates/yields, investors realize that the fundamentals are going to change enough to have a negative impact on the stock market. (The thinking that we’ll soon move from “bad news is good news”…to “bad news is bad news”…that we’ve been talking about for months is finally gaining some more traction in some circles around Wall Street.)
We do acknowledge that the Fed CAN sometimes be reverse their policy very quickly, BUT we’re afraid that this is not a reason to get overly excited. Let’s face it, they definitely flipped from tightening to easing VERY quickly in late-2018/early-2019, BUT that still didn’t keep the S&P 500 from falling 19.8% before it bottomed!
With all of this in mind, we do not believe this rally in the stock market is one that will see a lot of upside follow-through in 2024. In fact, it might not see much upside follow-through over the rest of this year. However, we do acknowledge that the quality of the recent rally has been quite good, so it’s not out of the question that we’ll see higher stock prices in the weeks ahead.
Be that as it may, we think that the stock market is misinterpreting what is going on in the bond market. (Remember, the market is NOT “always right.” It’s only “always right” eventually!) The stock market seems to be interpreting the recent decline in inflation as something that means we’ve returned to the era of “free money.” We think that’s wrong. We believe that it’s signaling a slowing of growth…which is not what you want to see when the stock market is still very expensive on an historical basis.
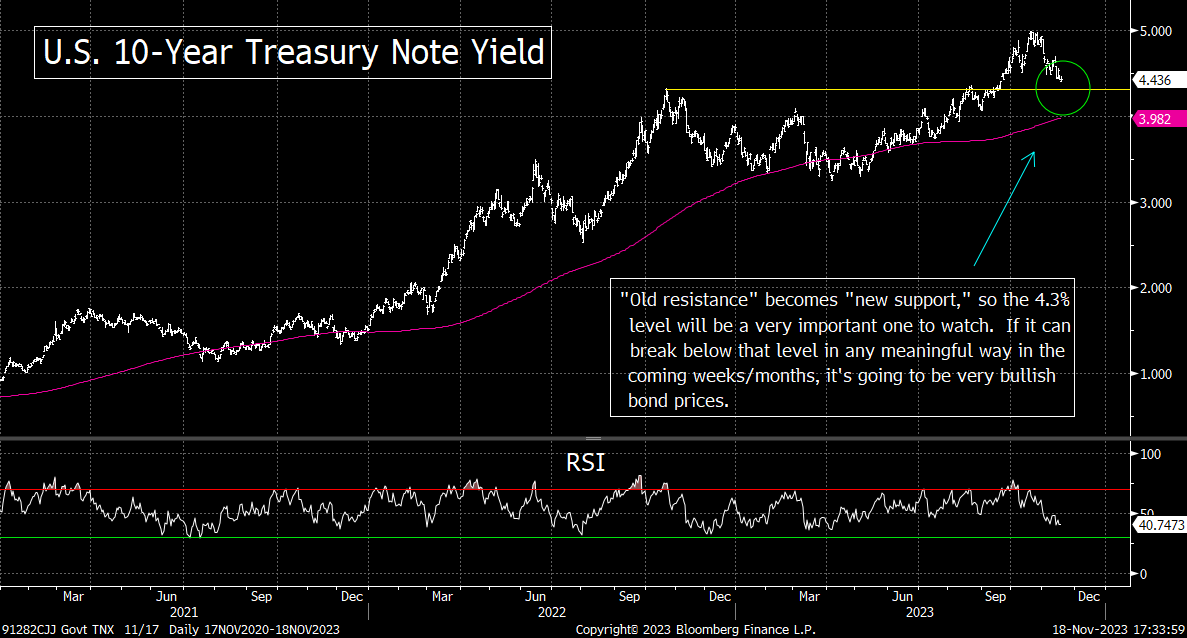
2) Let’s look at the chart on the yield of the U.S. 10-Year Treasury note. It has broken below the “head & shoulders” pattern we highlighted last weekend and is now moving very close to an important support level…near 4.3%. We’re not so sure that breaking below that key support level will be positive for stocks, but it WILL be very bullish for the bond market.
The yield on the 10yr note did indeed break below the “head & shoulders” pattern we highlighted last weekend. It also broke below the trend-line from the spring lows that we pointed out last weekend as well. This is quite a bearish development for longer-term Treasury yields…which means it was a bullish development for bond prices! This is particularly true given that bond yields are not overbought yet…and bond prices are not oversold yet. Of course, no market moves in a straight line…so anything can happen on Monday…but it does look like the trend we’ve seen over the past three weeks in the Treasury market will continue for a while longer.
As we discussed in our first point this weekend, we do not believe that a significantly further drop in bond yields will be a bullish development for stocks. However, it WILL be a very bullish development for bond prices…and thus bond investors…if (repeat, IF) it breaks below it’s next key support level in terms of yield. SO, let’s take a look at the next level to keep a close eye on. In our opinion, this level will be an extremely important one, so it will be something we’ll be watching very closely in the days and weeks ahead.
The 4.3% level was the “old resistance” level…as it was the high from 2022 and this past August. When it broke above that level, it skyrocketed to the 5% level in less than one month! Therefore, that breakout level (the “old resistance”) is now “new support.”…..With the 10yr yield sitting at 4.4% this weekend, it’s not too far from its “new support” level…so it could test that level before too long. (We do want to point out that the closing high from 2022 was 4.23%, so that will be another level to watch. We might need a material break below that level to confirm an important change in trend.)
Either way, the bond market is closing-in on a crucial area of support. It does not have to break below that line on its first test. It could easily bounce off that level initially…especially if it becomes oversold by the time it falls to that 4.3% level. However, if it eventually breaks below it in a meaningful way, it’s going to be VERY bullish for the bond market.
We have to be careful here. We do not know if a break below 4.3% will be the catalyst for a flipping of the switch from “bad news is good news” to “bad news is bad news” for stocks, but it WILL be an important development for bond investors. If the yield on the 10yr note breaks below that 4.3% level in a material way in the weeks ahead, it’s going to be a very bullish development for bond prices…and thus bond investors…….Of course, some people will argue that a decline below that level will merely mean that inflation is under control…and it will not signal a meaningful slowdown in growth. They might be right, but history says otherwise.
3) Basically, what we’ve been saying for a while now is that many of the reasons being put forward recently to be bullish on the stock market are ones that are not very bullish at all. In fact, some are outright bearish if you look at history. However, there IS one development that has taken place that does give investors reason to think that the stock market will rally right into the end of the year…is the tightening of credit spreads.
One of the themes that we have been pushing for quite some time now is the thought that some of the items that investors are using on the bullish side of the ledger…are actually bearish. Another one is that we believe that history shows that some of the other items they use in their bullish arguments are not as bullish as they try to portray.
On the former, as we pushed in point #1, a significant decline in interest rates and bond yields after a major rise in those rates/yields is bearish NOT bullish…an history backs us up on this contention. Another one we have harped on for months it the thought that it’s not the inverted yield curve that people should be worried about. It’s when the inverted yield curve steepens into positive territory that the situation really becomes a problem for many risk assets…including stocks.
In another example, we have pushed back on the thought that earnings are quite good. That is just not the case. Sure, they did not fall anywhere near as much as some pundits were predicting at the beginning of the year, but they’re still going to be basically flat this year! Therefore, this year’s rally has been based more on multiple expansion than anything truly fundamental. Since multiple expansion is just another way of saying that the stock market got more expensive this year, it’s not a real reason to fully explain this year’s strong advance in the market.
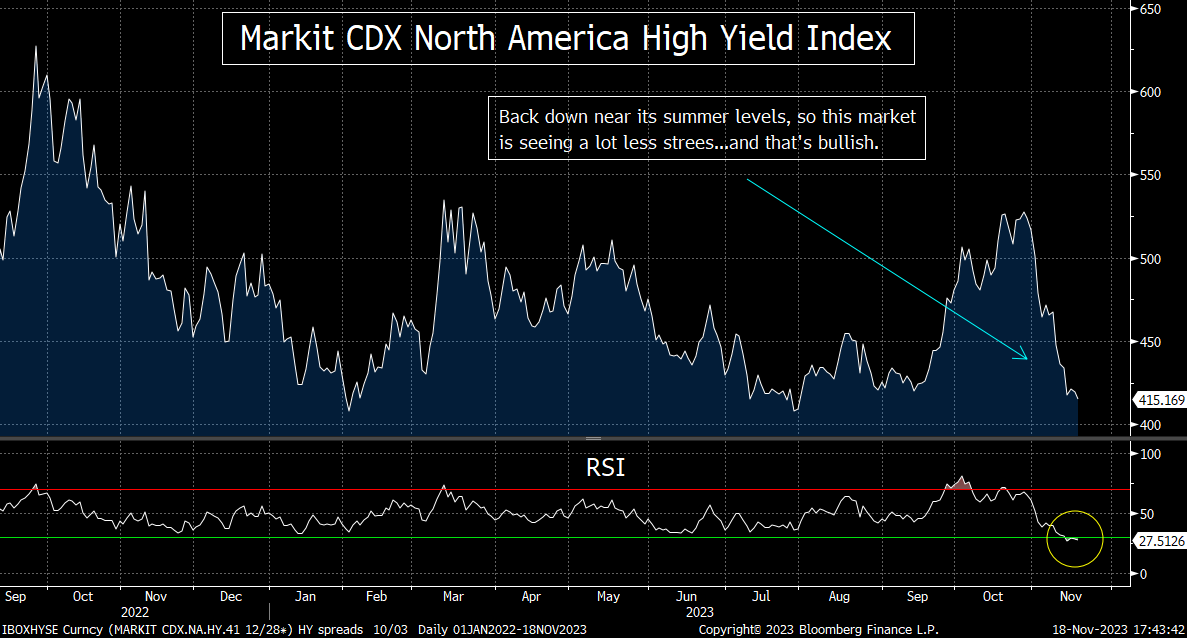
HOWEVER, that is not to say that there are NO reasons to be bullish right now…or to think that risk assets cannot rally further in the weeks (and even months) ahead. One of the most bullish developments has been the narrowing of credit spreads. Just look at the chart below. We’ve seen a huge decline (narrowing) of high yields spreads over the past three weeks. They have dropped back to their trend-line from the late-September 2022 highs…and are also within shouting distance of their summer lows!
As you can also see from this chart, the big decline in high yield spread from September of last year…to early-February of this year…was a very bullish signal for the stock market. Yes, they widened out significantly in February and March (during the regional banking crisis), but the decline from April into late July was another very bullish signal…and the rise into late October was quite bearish. Therefore, now that they’ve narrowed significantly again, it’s not a big surprise that the stock market has rallied strongly in recent weeks.
The bad news is that high yield spreads tend to be a coincident indicator…rather than a leading indicator. Therefore, the fact that they’re quite low doesn’t tell us a lot about what will happen going forward. Having said that, the recent decline is the type of trend that should give the bulls some solace as we move through the last part of 2023.
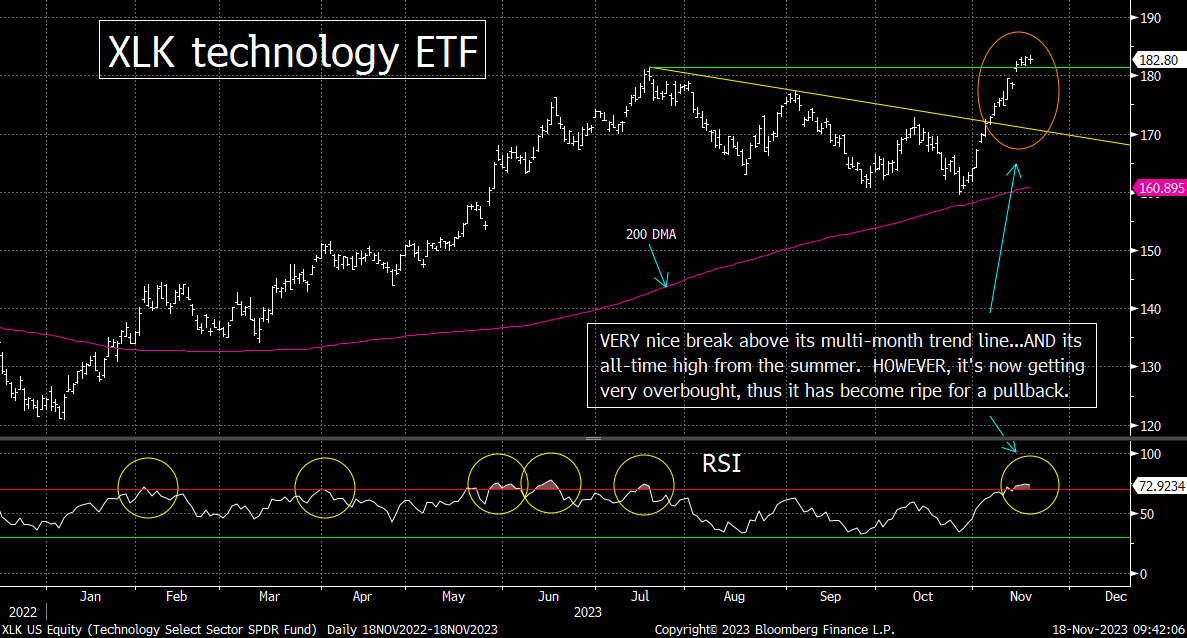
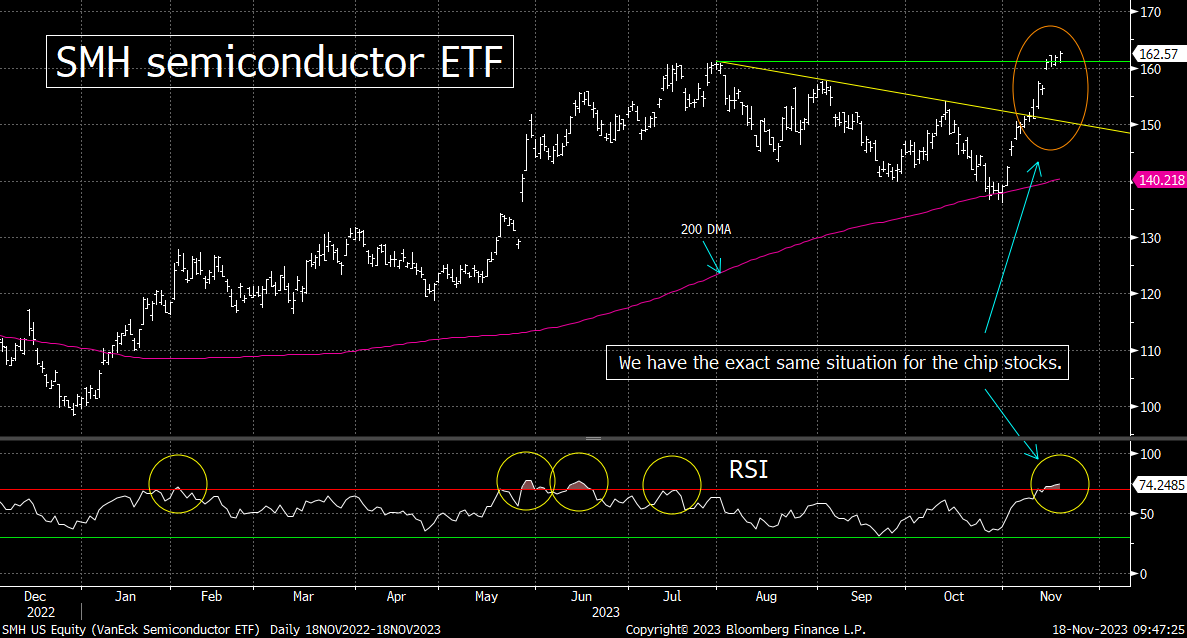
4) The tech stocks have obviously had a GREAT run over the past three weeks. However, the tech ETFs and many of the individual tech stocks are getting quite overbought. Therefore, investors and traders alike should be careful about chasing them up at current levels over the near-term.
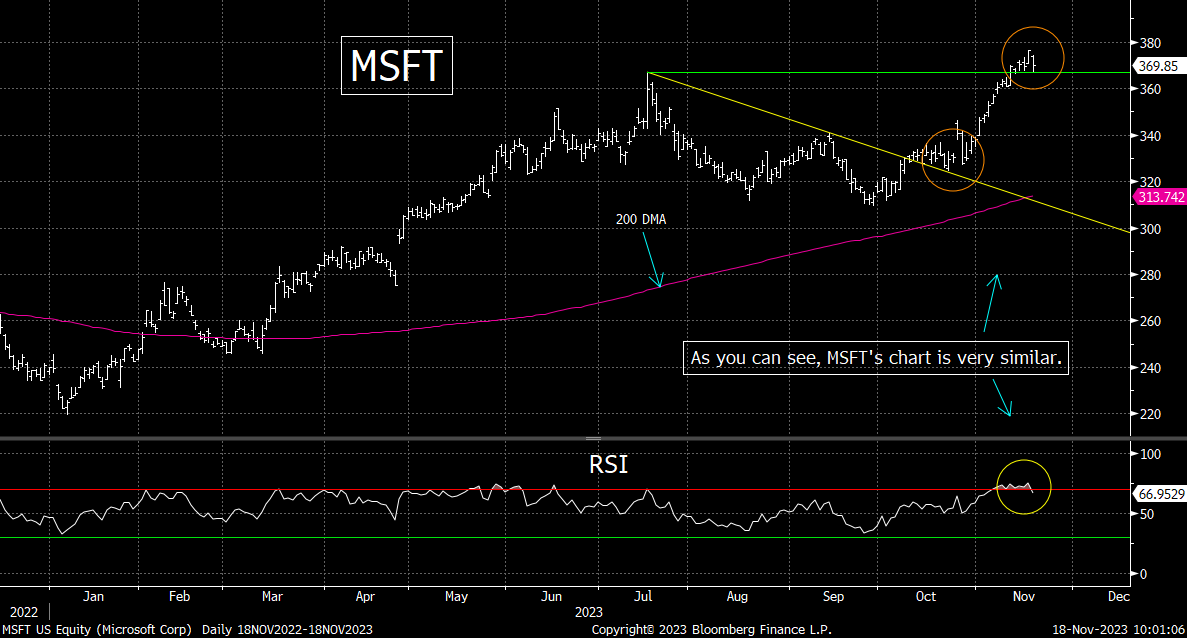
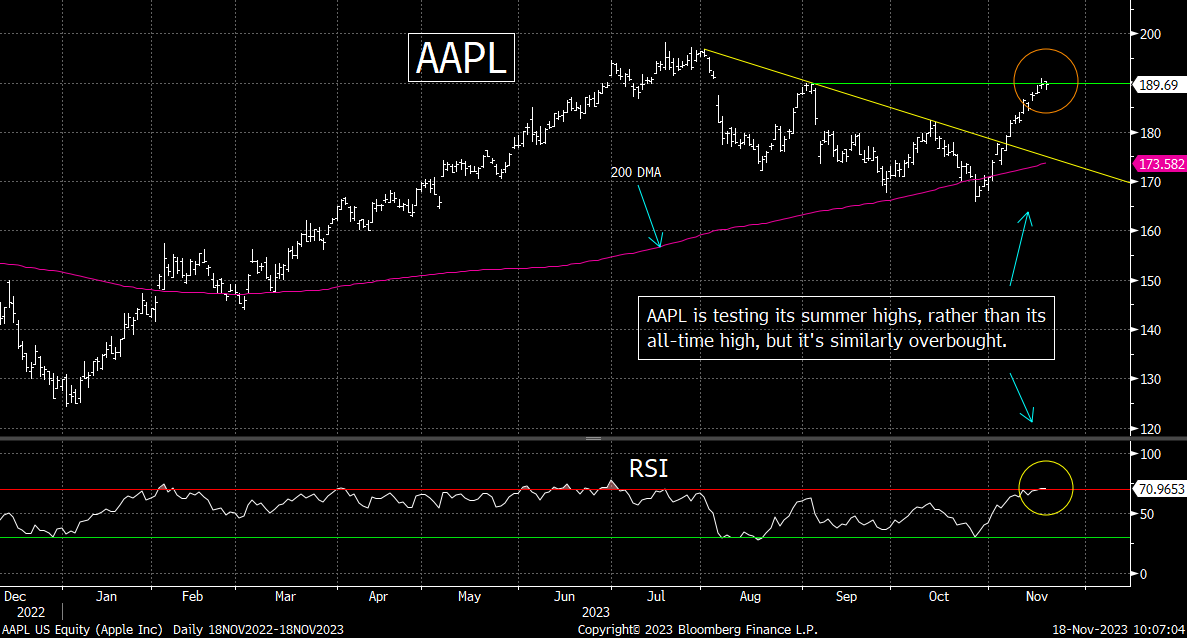
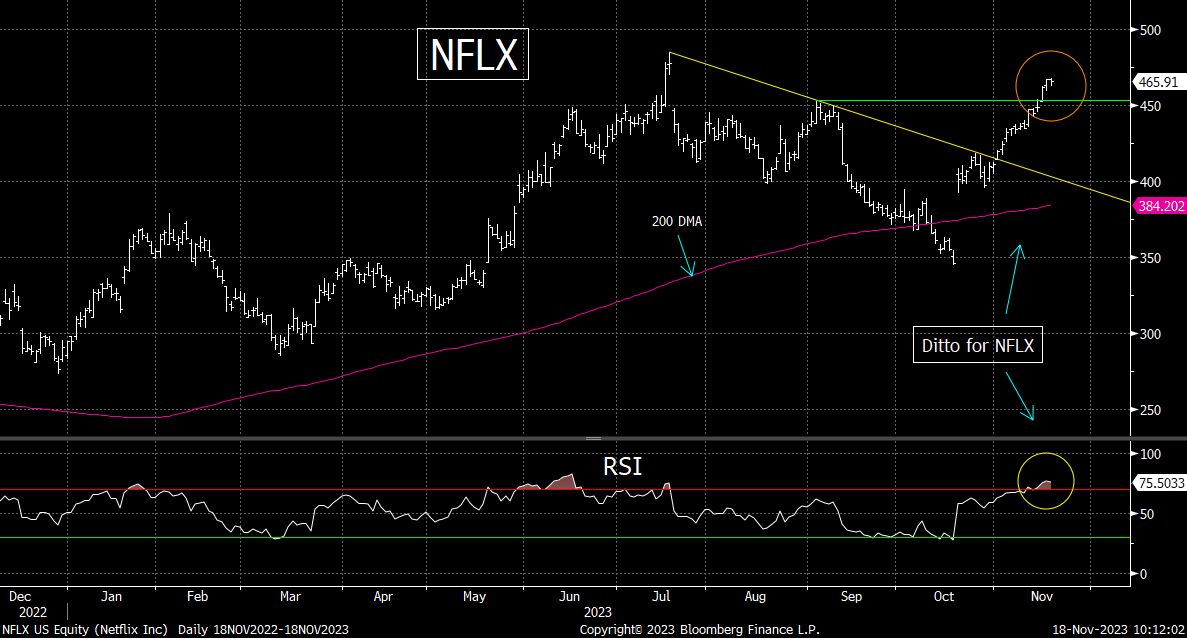
The run in the tech stocks has been a fabulous one over the past few weeks (duh)…and the sector has outperformed the broad market once again. The XLK tech ETF has advanced 14% and the SMH semiconductor ETF has jumped over 18%...and both have moved to new all-time highs! We do need to point out, however, that both of these tech ETFs have become quite overbought on a near-term basis. Therefore, they are becoming ripe for a pullback to work off these overbought conditions…….The same is true for several high-profile individual tech stocks…like Microsoft (MSFT), Apple (AAPL), Netflix (NFLX) and Meta (META)…which have all reached conditions that should be considered very overbought. Thus, they have become susceptible to some sort of pullback soon as well.
This does not necessarily mean that the recent moves to new highs are going to fail…and turn out to be big head fakes. Any near-term pullback could turn out to be just mild “breathers” for these ETFs and individual names…that helps them digest their recent gains…before the tech sector gives us a more meaningful breakout move in the coming weeks. In other words, it will take a serious downside reversal over the next two weeks or so…to offset the strong momentum these stocks have gained over the past few weeks. That said, as you can see from the charts below, they are definitely getting quite extended, so investors and traders alike should be careful about chasing them aggressively up at these levels.
Of course, if they DO reverse to the downside in a major way…to a similar degree that they did to the upside just three weeks ago…it’s going to create some real problems for the group. This is especially true now that most of these names are now flirting with the same kind very valuation levels that existed at the summer highs. With this in mind, we cannot assume that any near-term breather will definitely be followed by another big upside move. Either way, however, we do expect these stocks to take a breather quite soon.
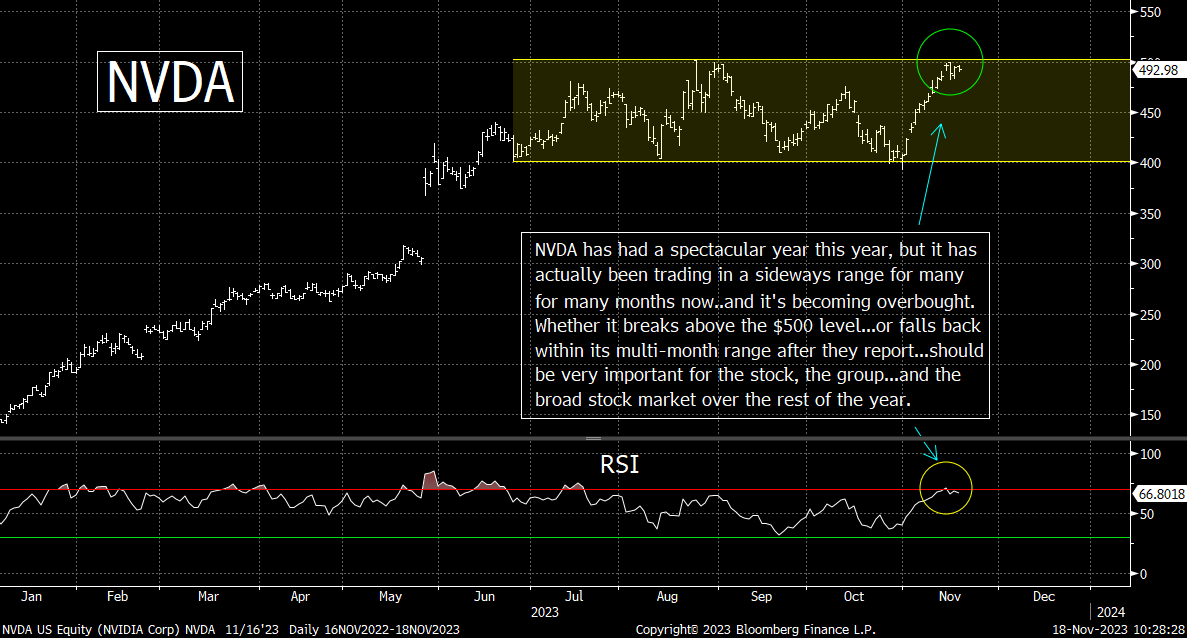
5) As much as we definitely believe that the tech sector is due for a pullback, it might not come immediately. We get the earnings from Nvidia (NVDA) Tuesday evening. So, how this stock reacts to its earnings will be VERY important for the tech sector. Remember, each of the last two NVDA earnings reports have been FABULOUS. However, only one of them was followed by a big rally. The other one was followed by a deep correction. Therefore, it’s hard to predict how this one will fare…especially given that NVDA has become overbought near-term.
There is absolutely no question that NVDA has been an unbelievable stock this year. It’s YTD rally of over 230% has been fabulous. However, it is worth noting that the vast majority of that gain came by the middle of July. Therefore, the stock has been stuck in a sideways range for several months now. Thankfully, NVDA was able to bounce strongly off the bottom of that range three weeks ago. Now, it is testing the top end of that range…and whether it can finally break above that range…or roll back over and fall back into the middle of it…will be very important for how the stock finishes the year (and very likely how the rest of the market behaves into year-end as well).
With NVDA’s earnings report coming after the close on Tuesday, we should get our answer at some point soon. There are plenty of reasons to think that NVDA will report another great quarter. However, we have to remember that they have reported extraordinary earnings each of the last two quarters…but the reaction to each report was decidedly different. When they reported in May, the stock jumped in a MAJOR way…and then kept on rising over the next two months. However, when they reported in August, the stock rolled over (after an initial jump)…and declined almost 20% over the next two months. Therefore, there is no guarantee that another good report will cause another extended rally…especially now that NVDA has become overbought after its recent big run.
Thankfully, we have a very distinct level to watch as the stock trades in the days following their earnings announcement. If it can move above $500 in a meaningful way…and stay above it as we move past the Thanksgiving Holiday week…it’s going to be very bullish. If, however, it rolls-over in any material way (even if that comes after another initial pop), it’s going to create some headwinds for NVDA…and likely the rest of the tech sector…in the month of December.
NVDA is a GREAT company with GREAT prospects. It will almost certainly be trading at a much higher level 5 years from now compared to where it is today. However, no stock moves in a straight line, so we’ll want to see how it trades during the week or so following its earnings report. How it trades should have a big impact on the tech sector for the rest of the year…and very likely for the entire stock market as well.
In other words, even though we expect NVDA to report another great quarter, we’re concerned that it might be too overbought on a short-term basis to give it the kind of boost that will take it significantly above its all-time highs from the summer. If it DOES break…and hold…above that level, it’s going to be very bullish. However, if it rolls-over, the decline just might surprise a lot of people. (The same could be true for a lot of other overbought tech stocks.)
6) Let’s update the charts on the S&P 500, NDX Nasdaq 100, and the Russell 2000. The broad averages all broke several resistance levels last week, so that’s obviously positive. We do need to point out that the SPX & NDX are getting overbought at the same time they’re testing new important resistance levels. Thus, they should see some sort of pullback at some point soon……..The Russell is not as overbought yet. There are two definitive items to watch in its chart that should tell us whether the small caps are really breaking out or not.
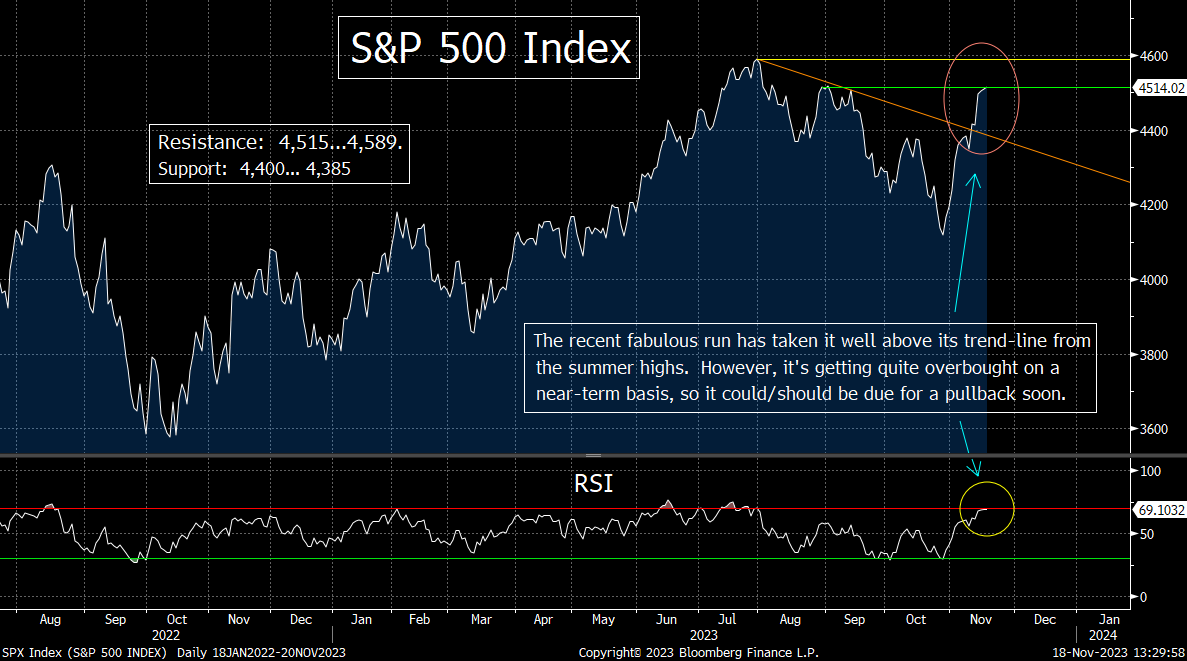
As usual, we’ll start with the S&P 500 index. The break above the 4,400 last week was definitely a meaningful one…and also took it well above its trend-line from its summer highs. It is now bumping up against its late-August/early-September highs of 4,515. If it can break above that level, the next resistance level comes in at the summer highs…just below 4,600 (4,589 to be exact). If it can break above the summer highs, investors will start focusing on the all-time highs of 4,800 rather quickly.
We do need to point out that the SPX has become overbought on its RSI chart, so it could/should be due for at least some sort of a short-term pullback soon. That doesn’t mean that this rally is going to run out of gas in a major way soon. It could just mean that it needs to see a mild pullback…or even a sideways “breather”…to work-off this overbought condition before the rally resumes……Of course, there’s no guarantee that the S&P will see any kind of pullback/breather. However, at least some sort of drop does seem likely at some point soon (no market rallies in a straight line). If it does, the key support level will be at 4,400. A drop below that level would take the SPX back below its trend-liune from the summer high. That, in turn, would suggest that the decline is more than just a “breather”…and would raise concerns about a bigger decline.
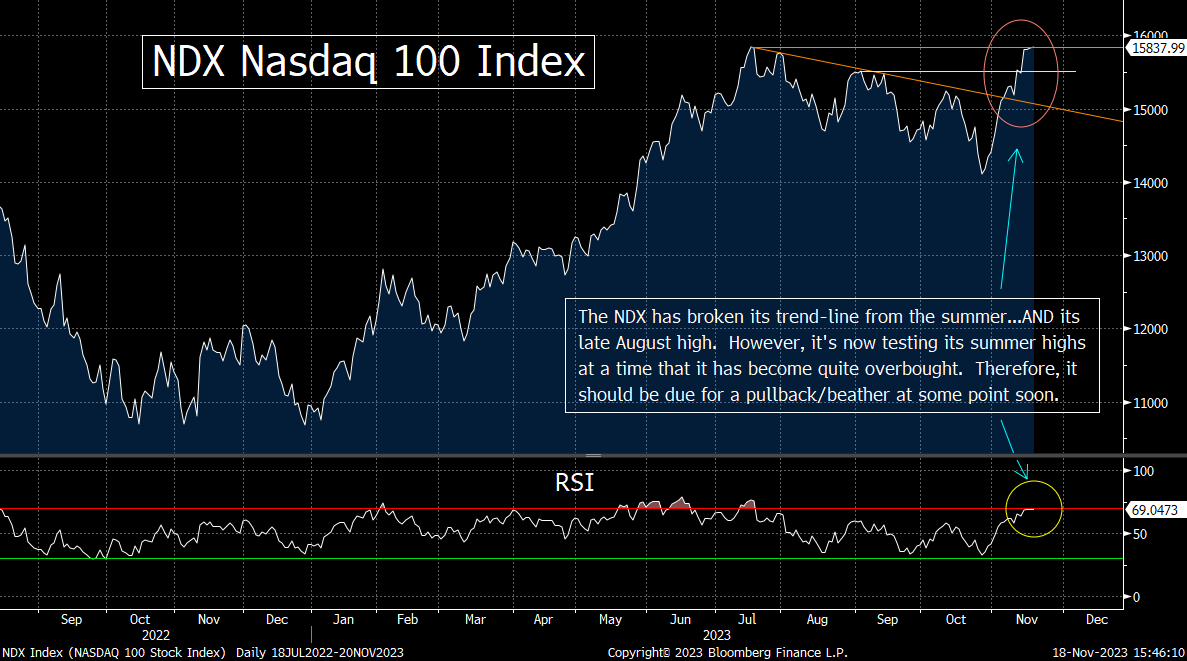
For the tech laden NDX Nasdaq 100, last week’s advance took it above its late-October highs (and well above its trend-line from last summer). However, like the S&P 500, it’s getting quite overbought. Sure, it can get more overbought before it tops-out on a short-term basis, but it does now have permission to see a pullback of a breather at some point very soon. Whether that kind of breather comes due to the reaction to NVDA’s earnings…or sometime after that…remains to be seen. However, investors need to be VERY careful about assuming that this rally will move in a non-stop fashion into the end of the year.
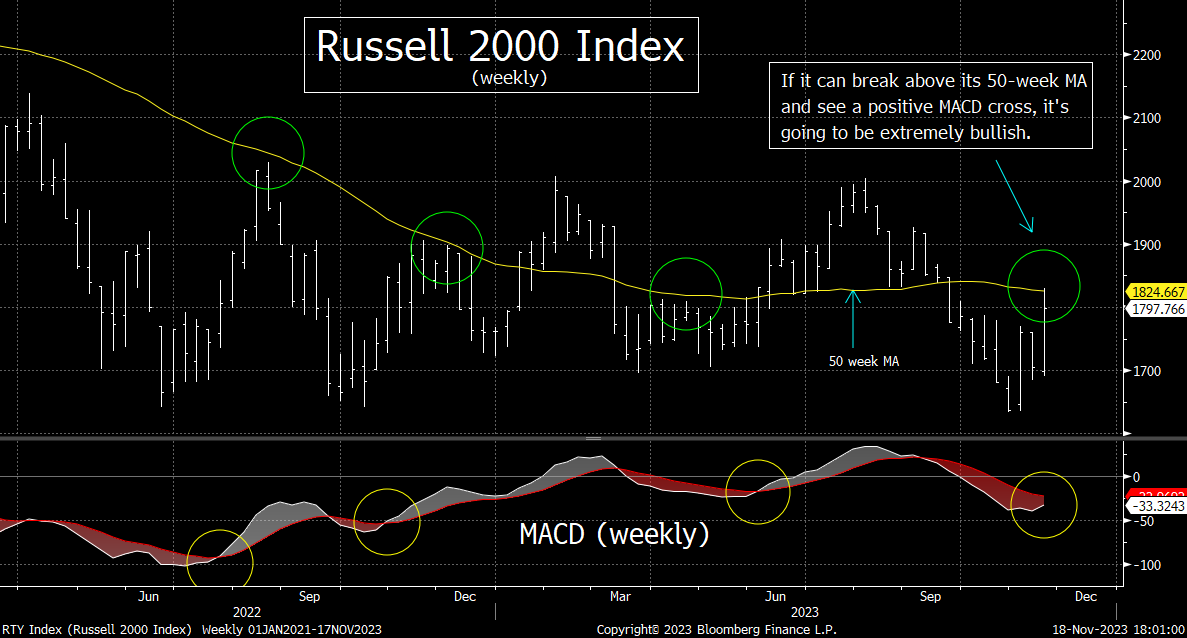
As for the Russell 2000, we’re actually think the weekly chart on this index is the most compelling one to look at. (Before we do, want to point out that the daily RSI chart on the Russell is not overbought quite yet…like it is for the SPX and NDX.) Anyway, if you look at the 50-week moving average, that provided some very tough resistance in August of 2022…and then again in November and December of last year. The same was true in April of this year. The Russell dropped back below that line in September (after pushing above it for a while during the summer). It got right up to that line last week…and then pulled back. Therefore, it looks like it might be a tough nut to crack once again.
That said, we’ll also be watching the weekly MACD chart on this small cap index. As you can see from the chart below, a positive weekly MACD cross has been followed by some very strong (further) rallies over the past two years. So, if this index can break above its 50-week MA…and see a positive MACD cross on its weekly chart…it’s going to be a very bullish development on the technical side of things…….As you will see in point #8, we’re skeptical that this kind of breakout can take place. However, if it does follow this scenario, we’ll have to become a lot more constructive on the Russell.
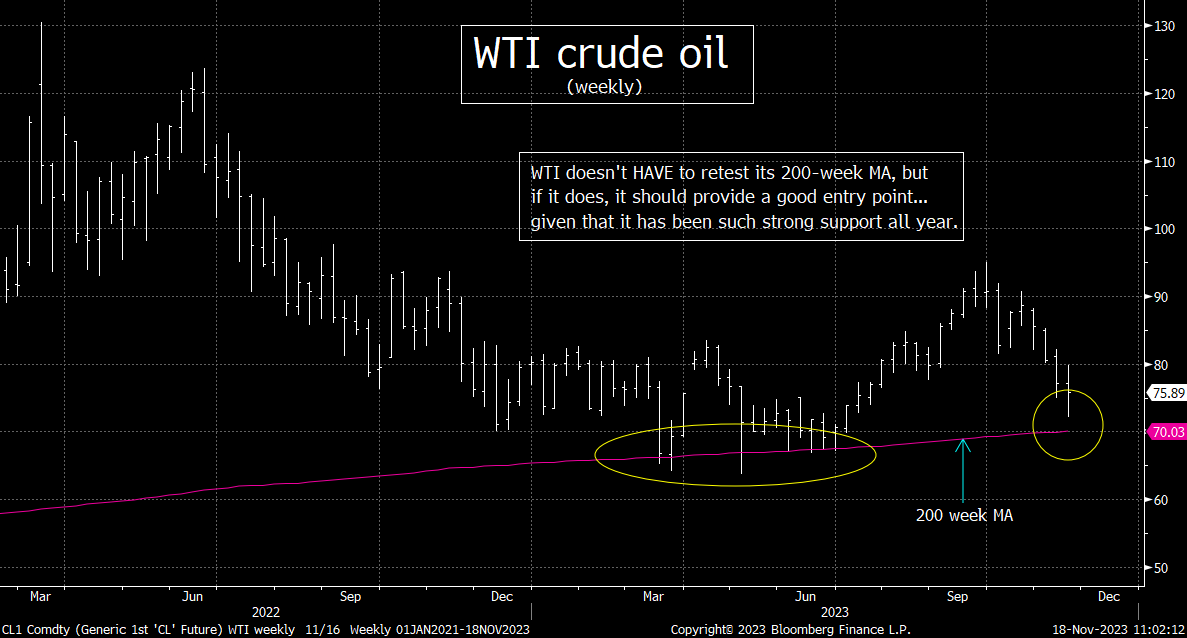
7) As we thought it would, crude oil saw some more weakness last week. Thus, our recent cautious call on the commodity and the energy stocks has worked out well. However, it could/should be getting close to a good time to wade back into this group. There is one key level to watching in crude oil…and another important chart to watch on the XOP ETF. These should give us a better idea about the timing of the next rally leg for oil and the energy sector.
Our near-term cautious call on the price of oil and the energy stocks has worked out very well. As we thought it would, crude oil dropped further in the last week (although it was able to trim some of those losses on Friday). We still believe that the commodity will do well over time. In fact, with the OPEC meeting just around the corner…and the black gold now becoming oversold after its 16% decline…we seem to be getting close to a level where investors can start adding to energy stocks once again.
That said, there are certainly some concerns about the demand side of the equation…especially with the surprising weakness in growth out of China this year. (We suppose China’s weakness is no longer a surprise, but it’s still a huge surprise compared to what people were thinking this time last year…when China was removing its covid restrictions.)…..Speaking of China and their economic weakness, we’re guessing that President Xi does not want oil prices to skyrocket right now…and exasperate the significant weakness China is experiencing. We don’t know how much influence he might have on this issue, but it still seems to us that the Saudis want crude price to stay elevated…even if they don’t push them above $100 going forward. Thus, we think the OPEC meeting will likely be a catalyst for a bounce in crude oil of its present oversold condition.
This does not mean that Friday’s bounce was the beginning of that rally. We’re still looking at the 200-week moving average for WTI. That level has provided excellent support this year…as it bounced off that line in seven different weeks during the spring and summer. This does not mean that it HAS to test that level once again before it bounces in a material way, but if it does drop to that 200-week MA, it’s going to be an attractive entry point on a technical basis.
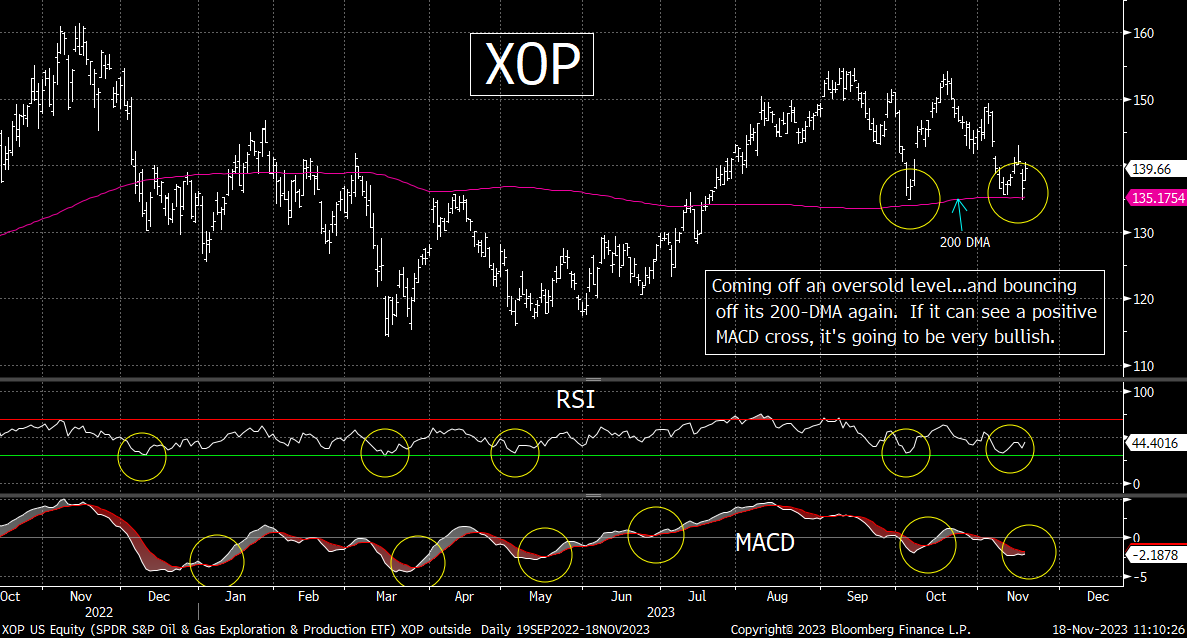
In case crude oil does not drop back to that key moving average, investors might want to look at the XOP oil and gas E&P ETF. This should be a good way to add to exposure to the energy stocks…by nibbling on this ETF now…and then adding even more shares once we get some confirmation that the group is going to see another rally leg. (In other words, once we get more confirmation…investors can buy more of the XOP…and ALSO become more confident in adding to the shares of the individual energy stocks they already own and/or like.)
Well, what will give us confirmation??? We will be looking at the MACD chart on the XOP. This ETF is already bouncing off an oversold level…and now its MACD chart is curling higher. You can see that over the past year, once the XOP has seen a meaningful MACD cross, it has been followed by some very impressive (further) rallies over the following weeks/months. Therefore, that kind of move should be the confirmation we need…if we do indeed get a material positive cross.
If you follow that strategy, you can use the 200-DMA on the XOP as your stop-out level. The XOP bounced strongly off that line in early October…and has bounced off it again twice this month. Therefore, if it breaks below that line, you can exit the new positions…and look for a better entry point. However, if it runs higher, you will have the confidence you need to add to the positions…….Either way, we remain bullish on the energy stocks on an intermediate-to-long-term basis…so although we’ll want to remain nimble near term, we’ll get more aggressive at some point soon.
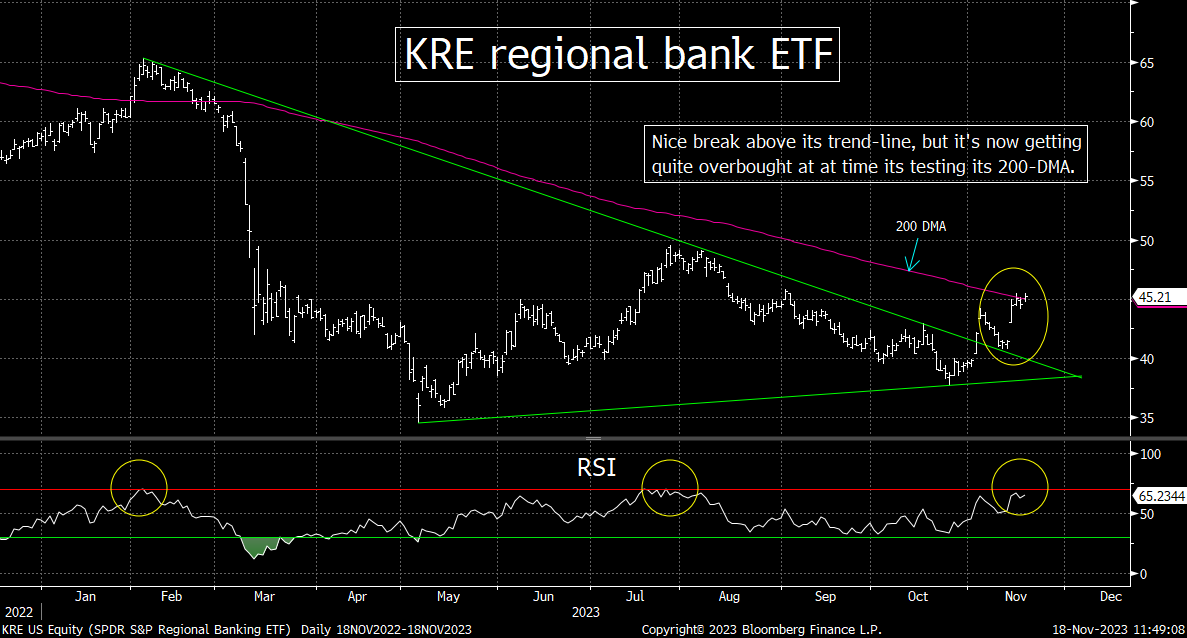
8) A lot of people seem to be turning very bullish on the bank stocks right now…especially the regional banks. On the technical side of things, we can understand why they are, but on the fundamental side of things, it’s a tougher argument. We’d also say that the comparisons the big rally they saw after the early/mid-1990s banking problems are off base in our opinion.
Like just about all of the stock market, the KRE bank ETF has seen a nice rally over the past three weeks. On the technical side of things, this bounce has been an excellent one for the regional banks. First of all, the low in late-October came at a higher level (a “higher-low”) than we saw in May (at the height of the regional banking crisis). It has also seen a couple of other more minor “higher-low/higher-highs” since then. Finally, it has broken above its trend-line from its February highs in a significant way…which could also been seen as a break above a “symmetrical triangle” pattern. These are all positive developments.
If there are some reasons, however, to be hesitant about the technical action of the KRE. First of all, the fact that it’s still WAY below its trend-line from the early 2022 highs creates some problems for this ETF. (It’s MUCH further below the trend-line from those highs than the major averages…and most other sectors.) It’s also bumping up against its 200-DMA. That line provided tough resistance in August, November, and December of 2022. Thus, it could provide some resistance right now as well. (It did get slightly above that line each time…but it could never fully pull away from that moving average.) Finally, the KRE is getting overbought on its RSI chart. It has not quite reached the overbought level we saw at the February highs or the July highs, but it’s quite close. Therefore, it could/should see some sort of near-term pullback soon…even if it’s only a temporary one….before resuming its climb. (So, either way, investors should be careful about chasing these neames up at current levels.)
However…and more importantly…we’re still concerned about the fundamental backdrop for the banking sector. Just because their unrealized losses of their bond portfolios are not as large as they were three weeks ago, it does not mean they’re suddenly small. In fact, they’re still EXTREMELY large!.......Also, even though bond yields have come down, deposit rates at these banks are still far too low to compete with other cash accounts. They continue to lose deposits…with reports that even the big guys are losing them in a significant way…to the tune of $68 billion last week. These continued loss of deposits does not bode well for profitability going forward…especially when the latest Senior Loan Managers Survey was again quite pessimistic.
Finally, the banks cannot do what they did in the 1990s when they were coming out of another crisis back in those days. They cannot “ride the yield curve” like they did back then…for the simple reason that the curve is still inverted. “Riding the yield curve” played a VITAL role in helping nurse the banks back to health in the 1990s, so the absence of this ability is not a good situation. Of course, the yield curve will certainly steepen back into positive territory at some point in the future…but as we have pointed out many times in the past, that kind of steepening is not something that signals the kind of strong economy that helps banks thrive. When the yield curve steepens back into positive territory, it usually involves a bigger drop in short-term yields…which signals a recession (or that something has broken).
This does not mean that the banks are in serious trouble. However, the fact that the KRE and KBE bank ETF both dropped twice as much as the broad averages did this during the August-October decline (after already being in negative territory for the year)…did raise our concerns in a compelling way…..Either way, they are certainly still facing some serious headwinds, so we have to be careful about assuming that the recent break above its trend-line from July is definitely signaling an important low for the bank stocks…….Again, the recent action in the bank stocks has been impressive. However, we’ll just like to see the KRE break above its 200-DMA in a very compelling way…either now, or after a short-term breather…before we can get more excited about this group.
9) The markets are not pricing in any chance that the conflict in the Middle East will spread into a full regional conflict. This might be the correct response. However, from everything that is being said by the top leadership of Israel, they are not going to stop short of their goal to completely destroy Hamas. That could mean a very long process…which, in turn, raises the odds that the conflict will eventually spread.
After listening to extended interviews with Israel Prime Minister Netanyahu last weekend…and Israel Economy and Minister Barkat this past week…it only confirmed our thought that Israel is indeed going to do whatever it takes to wipe out Hamas as a threat to their country. “We are going to finish the job,” says Mr. Barkat. (We are not saying anything about what we believe Israel should or should not do. We’re merely stating what they’re saying in a very emphatic manner.)
We are not experts on the Middle East…but these emphatic comments on this issue from the leadership of Israel has not faded at all. No matter what one thinks about what they should or shouldn’t do, it sure looks like they are not going to stop trying to reach their stated goal. (To be honest, we question how much impact outside pressure will have on the Israelis…when they look at this issue as a threat to their existence.)
Again, we are not geopolitical experts, so we won’t go too deeply into this subject…and since our analysis only deals with what this issue will have on the markets, we’re not going to talk about what we think the Israelis “should” do going forward. It’s just that it doesn’t look like this is going to end quickly. That doesn’t mean the crisis will spread into a wider Middle East conflict. There are certainly some global powers who don’t want it to spread (like China). However, the fact that Israel seems determined to keep pushing hard, it does raise the odds that the situation will spread at some point. If it does…and it has a significant impact on oil prices this winter…it’s going to have a big impact on the markets as well…and it will do so very, very quickly.
9a) It’s absolutely pathetic that it took an anti-Semitic comment from an extremely famous person to lead the consensus to finally start condemning the recent (huge) rise in antisemitism….but at least it’s finally being condemned.
10) Summary of our current stance………Thanksgiving week tends to be a positive one for the U.S. stock market, but like most seasonal trends, it’s not a perfect one. This year, we’re heading into the week with a market that has become overbought, so that will likely make it difficult for stocks to head a lot higher next week. That said, we get an incredibly important earnings report from NVDA…and how that stock and the rest of the tech group reacts to that report should be quite important. If it rallies strongly…like it did in Q2), it will be quite bullish…but if it reacts poorly (like it did in Q3…even though the earnings & guidance were VERY strong), it will be disappointing for investors.
On an intermediate-to-long-term basis, we’re quite skeptical…no matter what happens next week…or over the rest of this year. Despite the fact that we keep hearing the narrative that says the consumer is still in great shape, we keep hearing the exact opposite from many key retailers. We also keep hearing statistics that describe the consumer’s balance sheet as still being in great shape, but also see stats that show how much of the pandemic savings have been run down…how much credit card debt is rising…and how credit card and other individual debt stats keep rising. How can the consumer remain incredibly strong in the future…when over 60% of Americans live paycheck to paycheck…and delinquencies are rising so fast?.......God help us if last months weaker-than-expected jobs data becomes a trend.
There are other reasons to be concerned. There is little question that growth is slowing. For example, the Manufacturing PMI data remain well below 50. Even though the services side of the economy continues to be highly touted, the Services PMI number is only barely above 50 (50.6)…and it came in at a lower-than-expected level last month. However, our biggest concern comes on the earnings front. Yes, people have been able to claim that this past earnings season was a good one…because the stock market has rallied in recent weeks. However, earnings estimates for both Q4 this year and full year next year did not improve at all. In fact, they came down very slightly. This will make it very tough for than expensive stock market to rally a lot further…because even though interest rates/bond yields have come down, they’re still A LOT higher than there were at the beginning of the year.
Of course, some people will say that as long as we can avoid a recession (like many thought we would by now) and as long as earnings don’t decline (ditto)…the stock market can just keep on rallying. We do not agree with this assessment. Since interest rates/bond yields have risen by so much this year, we’re going to have to see an improvement in growth…AND a big surge in earnings…in order to justify today’s level in the stock market. Merely avoiding a recession and seeing a mild increase in earnings won’t do the trick anymore…given that bond yields are still higher than anything we’ve seen over the past 16 years (except for a few weeks in October). Let’s face it, if S&P 500 companies can actually meet the consensus 2024 estimates (which is a BIG if)…the index will still be trading with a multiple well above 18x!
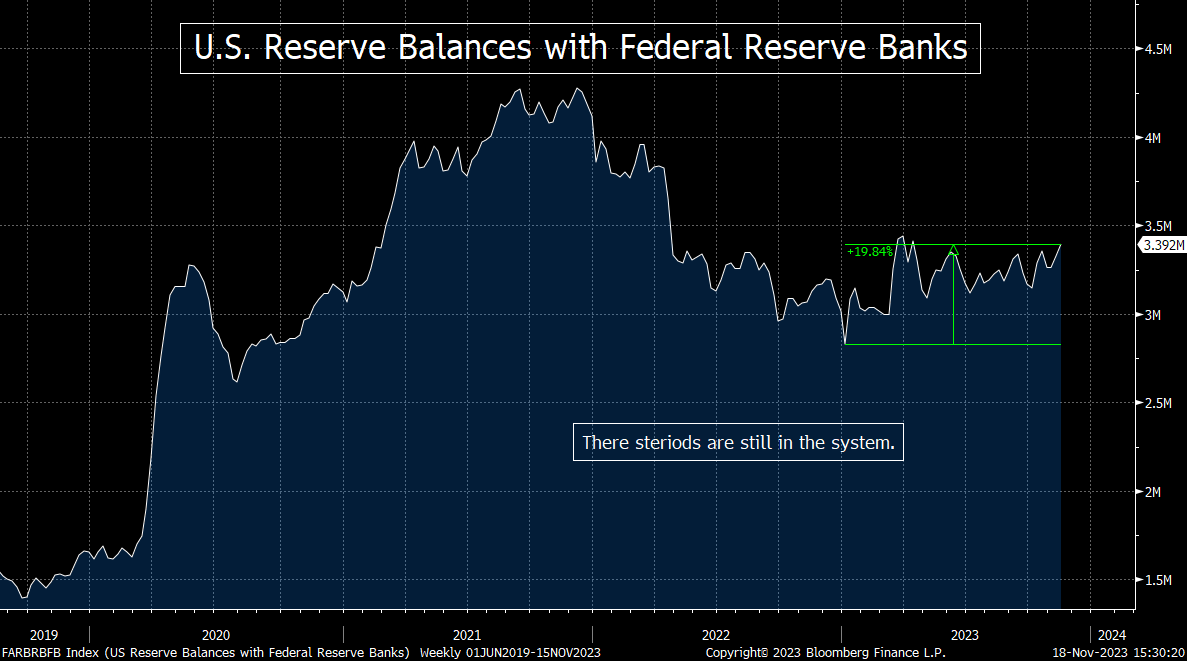
Having said all this, anything is possible in today’s markets. Despite their QT program, the Fed is keeping liquidity plentiful…as can be seen by the Reserve Balances with the Federal Reserve Banks. They have been rising since early October and are closing in on the levels we saw just after the Fed injected large levels of liquidity into the system to help with the bank runs caused by the failure of SVB. In fact, they’re up almost 20% from their early January lows (the lowest level since the Fed began tightening). Therefore, the markets can still trade above the levels that can be justified by the underlying fundamentals for a while longer. However, they can’t do that forever.
Matthew J. Maley
Founder, The Maley Report
TheMaleyReport.com
matthewjmaley@gmail.com
Although the information contained in this report (not including disclosures contained herein) has been obtained from sources we believe to be reliable, the accuracy and completeness of such information and the opinions expressed herein cannot be guaranteed. This report is for informational purposes only and under no circumstances is it to be construed as an offer to sell, or a solicitation to buy, any security. Any recommendation contained in this report may not be appropriate for all investors. Trading options is not suitable for all investors and may involve risk of loss. Additional information is available upon request.