
Good Week for the Markets, But the Fundamental Backdrop Got Worse.
The markets preformed well last week...despite the fact that the fundamental and geopolitical backdrop deteriorated. The markets cannot ignore this for long.
Quick note before we get started: We have a lot of new readers, so I just want to reiterate that this weekend piece will usually have points that conflict with one another. My goal is to give people some thoughts from both sides of the bull/bear ledger…while still letting them know where I stand in terms of that ledger at any given time.
Also, I hope you will take time to read point #9 that deals with the political outlook. It is a very unbiased, but VERY intelligent look at political landscape America faces today…….Of course, my opinion about the quality of the comments IS biased…because this bullet point was written by my son…….However, if you take the time to read the entire section, I think you will find that his conclusions about today’s political environment are completely non-partisan…AND completely spot-on…………Thank you very much.
Table of Contents:
1) When long-term interest rates top out, it is NOT a sign of a bottom for stocks.
2) Update on the charts for the S&P 500 and the NDX 100.
3) Q4 is NOT usually a good quarter for stocks…when we in a bear market!
4) The bullish developments from last week were not all that bullish in reality.
5) The situation in China changed in major way this past month.
6) If we’re wrong about the economy, the small-cap stocks should fly going forward.
7) The trend in the dollar is showing some signs that it may reverse soon.
-8) Taiwan Semiconductor (TSM) is extremely oversold.
9) Politics….An extremely thoughtful and unbiased view of today’s political landscape.
10) Summary of our current stance.
1) A lot of people are wondering if long-term interest rates have topped. This might indeed be true. HOWEVER, investors need to be very careful about assuming that any top in interest rates will signal the low for this bear market in stocks…or even something that will give us a multi-month rally in the stock market. In fact, history tells us that a top in interest does NOT correspond with a low in a bear market for stocks…at all.
As we all know, when the Fed raises interest rates, they do it by raising very short-term rates (the Fed Funds rate). The Fed does not control long-term interest rates…the market controls that part of the bond market. (We do admit, however, that the QE programs of the last dozen years has helped the Fed have more of a direct impact on long-term rates than they have in the past. Still, it’s the short-term rates that they really control.) Don’t get us wrong, when the Fed’s policy pushes short-term rates lower or higher, we tend to get a similar move in longer term interest rates before long.
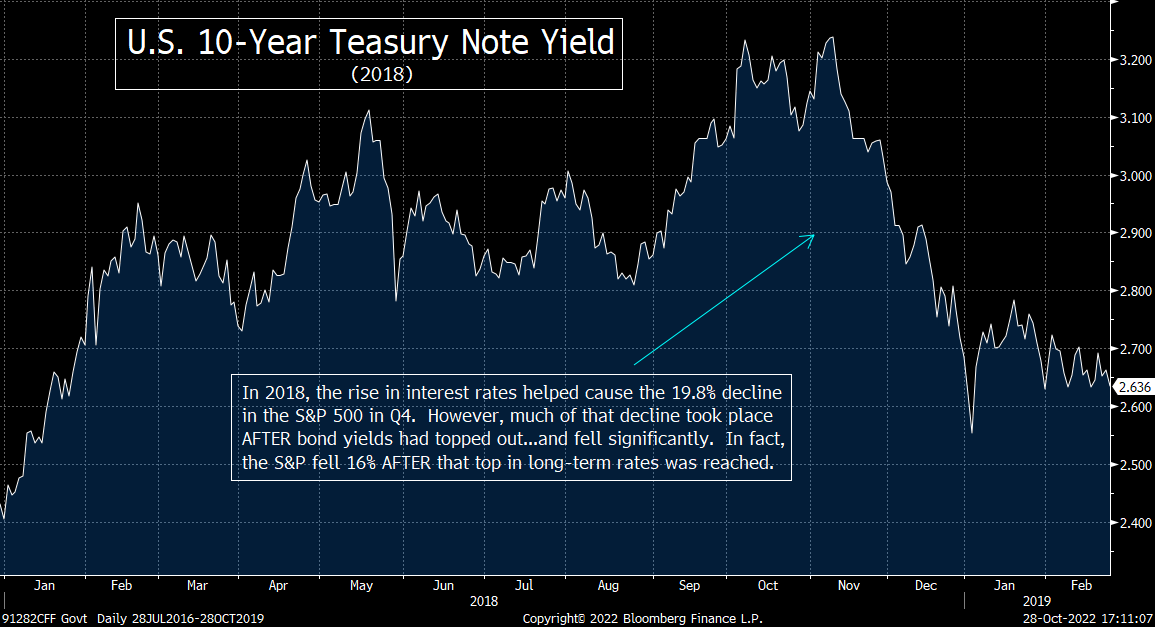
However, we do need to point out that short-term rates and long-term rates can move in different directions for an extended period of time every once in a while (like we saw in 2018). More importantly, it is imperative for investors to realize that when long-term interest rates reverse from an upward trend to a downward trend…at the onset, or in the middle of a bear market (especially when that bear market coincides with a recession), it is NOT bullish for the stock market. In fact, it is a very bearish development for stocks! (In many cases, it’s not until long-term rates actually start rising again that we see the last of the bear.)
We have spent a lot of time over the past six months highlighting that a Fed “pause” is not the same as a Fed “pivot”…and that that a slowdown in the pace of rate hikes isn’t even a “pause.” Therefore, we have been saying that the inevitable shrinking in the size of rate hikes will not be something that signals a bottom for this bear market. In fact, we have said that although the throttling back on the size of the rate hikes would create a short-term bounce, we do not believe it will be something that will cause a multi-month rally.
If you look at history, it tells us something very important about a monetary tightening cycle. When the Fed starts to tighten…buy raising short-term rates, long-term rates tend to move higher as well. This rise in interest rates across the board causes the stock market to decline before too long…as leverage starts to get unwound by investors and people start pricing-in a slow down in growth…due to the higher costs that higher interest rates bring for businesses and consumers alike. (Since the Fed has a more direct impact on short-term rates than long-term rates, the yield curve starts to flatten. When the tightening cycle becomes big enough to cause a recession, the curve tends to invert.)
This is when things get complicated. Yes, higher rates tend to be negative for growth…and thus positive for the stock market, and lower rates tend to be positive for growth…and thus positive for the stock market in general. HOWEVER, in the instances when we get a shift in trend from one where rising long-term rates over an extended period of time (during a tightening cycle)…to one where those long-term rates begin to fall…it gives us an IMPORTANT exception to that rule about impact interest rates have on the stock market.
History tells us that when the Fed embarks on a tightening policy, it eventually CAUSES the economy to slow and the stock market to decline. However, at some point, history also tells us that long-term interest rates SWITCH from being something that “causes” a slowdown…to something that SIGNALS a more serious slowdown in the economy and decline in the stock market is going to take place in the future. When that happens, long-term interest rates change from being a catalyst…to being an indicator. Therefore, the situation switches from be one where higher interest rates are bad for the stock market…to one where LOWER interest rates are actually a bearish signal for stocks.
In other words, when it becomes evident that a recession is all but inevitable, long-term bond yields top out and roll-over. When this takes place…and it becomes evident that earnings are going to have to decline…the stock market sees a FURTHER decline…and it’s usually a significant further decline! Therefore, in these instances, the change in trend for long-term rates is NOT a bullish signal for stocks…it’s the exact opposite.
Just look what has taken place over the past 50 years. In August 1973, the 10yr Treasury note yield topped out in early August…and rolled over by more than 10%. Yes, this drop in short-term yields WAS followed by a short-term rally in stocks, but it did not last. When it became evident that the reversal in long-term yield was signaling an upcoming recession, the stock market quickly rolled over. By the end of the year, the S&P had fallen 15% from its summer highs.
Similarly, in 1979/1980, the Fed’s tightening policy led to a big rise in yields. However, in February of 1980s, the 10yr yield topped out and fell by over 30% over the next four months. Again, this drop in yield did not help the stock market rally. Instead, since this drop in yields was SIGNALING an upcoming recession, the move was quickly followed by a 17% in the stock market. We’d also note that in 1990, the Treasury and stock markets followed the same script…and the reversal in long-term yields was followed by a 19% drop in the stock market.
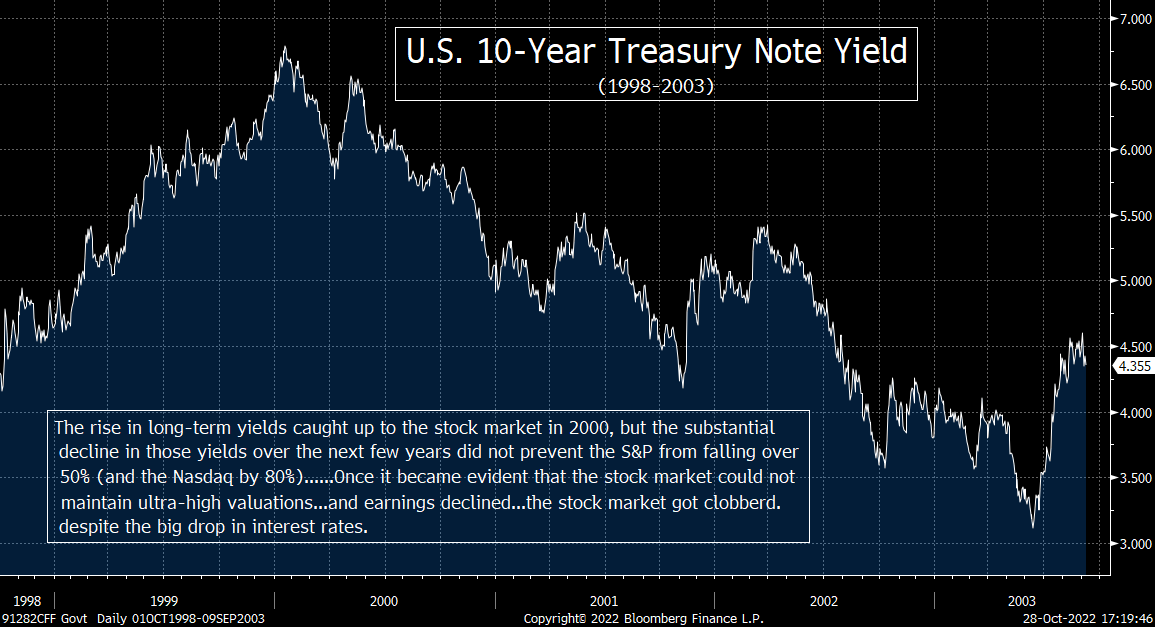
During the bear markets/recessions of the last 25 years, the situation has been even more pronounced. In late 1990s, the Fed began to tighten policy with short-term rate hikes…and long-term rates began to rise as well…with the 10yr yield rising from 4.1% to 6.7% in early 2000. It took a little while for the rise in interest rates to have a negative impact on things, but it finally started to in Q1 of 2000. At that point, long-term yields rolled back over in a significant way…and it was followed by a significant decline in the 10yr yield from 6.8% to 3.1% from 2000 to 2003. However, this decline in yields did NOT help the stock market. Once again, instead of “creating” a rally in the stock market, it “signaled” that we were headed for a recession. Therefore, instead of rallying, the stock market responded by falling 50% drop in the SPX (and an 80% decline in the NDX).
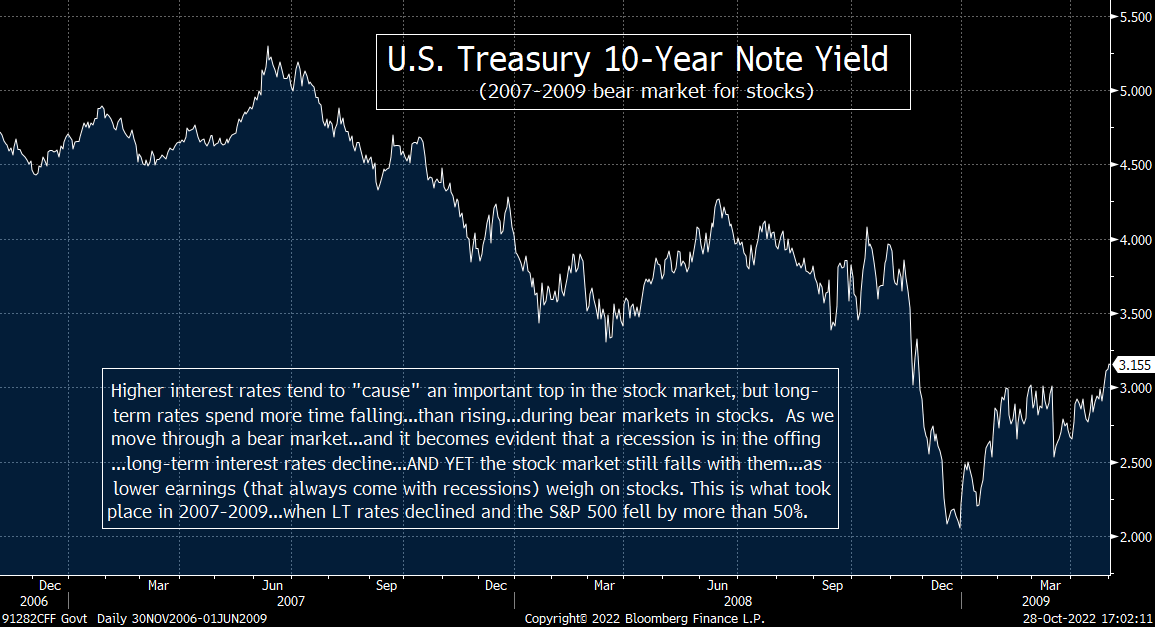
In the bear market/great recession of 2007-2009, a very similar situation played out once again. Another tightening by the Fed caused short-term and long-term rates to rise. However, by mid-2007, long-term rates rolled over from about 5.3% to just above 2%. Once again, the stock market did not respond to this decline interest rates in a bullish way. Instead…since this move in long-term yields was sniffing out a serious recession… stock market saw another 50% fall………..Heck, even in 2018…when the Fed did their infamous “pivot”…long-term rates topped out in early November, but the S&P did not bottom for almost another two months…after a further 16% drop. (That year gave us a perfect example of when long-term yields began to decline…even though the Fed kept raising short-term interest rates…and the stock market kept falling.)
Yes, the stock market did rally strongly in 2020 following a reversal in long-term rates in March of that year, but it took a historic and MASSIVE liquidity injection to create that rally. Therefore, If all the Fed does this time is shrink the size of their short-term rate hikes, it’s not going to have anything close to the impact they had when they suddenly engaged in their MASSIVE liquidity injections…and a zero interest rate policy.
Of course, each one of these examples had their own unique circumstances. However, they all share a important similarities. These bear markets all started after a period of monetary tightening. Then, when it became evident that we were heading for a recession, long-term rates began to roll-over, BUT the stock market KEPT FALLING…AFTER long-term rates fell. Yes, sometimes the stock market did rally for a short-period of time when those long-term rates first reversed direction, but once it became obvious that the reason rates were falling was due to a recession (which meant earnings were going to decline…like they always do in a recession), the stock market has always fallen further (and made lower-lows) AFTER long interest rates began to decline.
Of course, we’d have to look at the current situation differently if we thought the Fed was going to suddenly start to actually start cutting rates…or flood the system with liquidity (like they did in 2020). However, unless we get a big blow-up in the system (which would take the markets down before any major pivot like that), the Fed is merely going to shrink the size of their hikes. Since that is not a “pause”…much less a “pivot”…we do not believe investors should be as excited as they seem to be about a slightly dovish Fed or a possible top in long-term rates as we move through the rest of this year.
2) Let’s look at the charts on the SPX and NDX. Last weekend, we highlighted that the MACD charts on these two key indices were pointing to more strength over the short-term. Now that we’ve seen more strength, the question is whether we’ll see even more as we move through the last two months of the year. We don’t think the upside potential from current levels is as high as many on Wall Street do right now, BUT we DO have to admit there are reasons to think more upside is indeed possible.
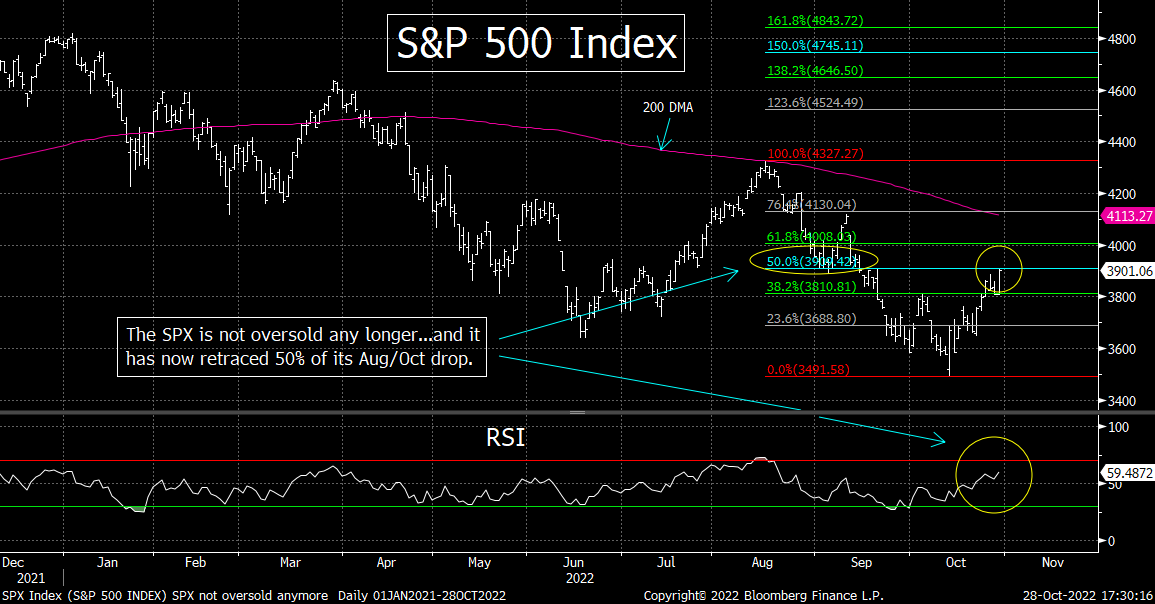
We highlighted the MACD charts on the S&P 500 Index and the NDX Nasdaq 100 Index last week. Their positive crosses were indicating that the stock market could/should see some more upside over the very-near-term. Sure enough, the SPX gained almost 4% and the NDX added 2%......In the SPX, the almost 12% rally off the October 12 intraday low has worked-off all of the oversold condition that existed at the very end of September. No, it is not overbought yet, so we do admit that it could rally further before we see the end of this bear market rally. However, we are much less confident than many on Wall Street that it’s going to last through the end of this year.
Near-term, the SPX is testing two resistance levels at 3900. This round number is also where the 100-DMA comes in…and it’s also the 50% retracement of the August-October decline on an intraday basis…so it would not surprise us if this level provided some tough resistance as we move through next week. If, however, 3,900 is broken in any meaningful way, we could be looking at a quick run up to the 200-DMA. That 200-DMA provided very strong resistance back in August, so it’s going to be quite difficult for the S&P to break above that level. This should be particularly true because the index would very likely reach an overbought condition if it reaches that level before long.
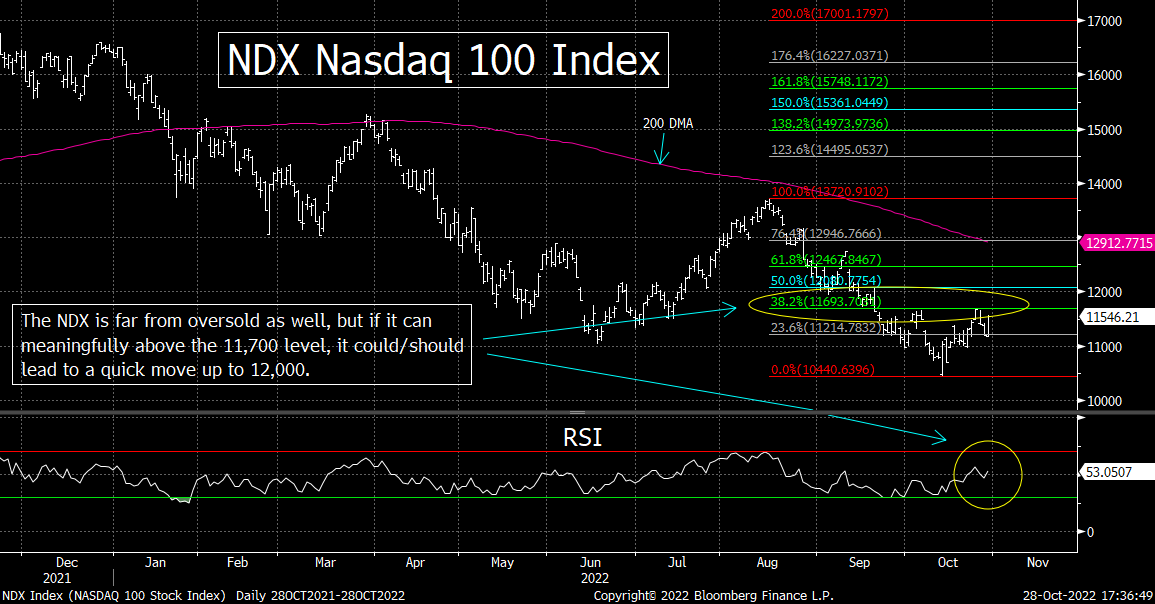
As for the NDX, it badly lagged the S&P in last week’s bounce…due to the horrible performance in the tech sector…following a serious of horrendous earnings reports and forward guidance. (We’ll have more on the fundamental issues facing the tech sector in later bullet points, but since this bullet point is concentrated on the technical aspect of what we’re facing today, we’ll stick with the charts for now.)….The NDX is not far from its October highs of 11,700. It has reached that level twice already, so it has provided some tough resistance. It is also a Fibonacci 38.2% retracement of the August/October decline, so this is another reason to think it could stop the recent bounce in this part of the stock market. (The 50-DMA comes-in at a level just above 11,700 as well.) However, if it can rally above this level, it could/should see a quick move above 12,000.
Therefore, if (repeat, IF) we get any upside follow-through next week from the Fed’s announcement/press conference…or for any other reason…it should tell us that the stock market will rally nicely until at least Election Day…….The overall sentiment in the marketplace is very bearish, but it sure seems to be extremely bullish for a year-end rally (and especially one through the midterm elections). No, we cannot quantify that kind of near-term sentiment…like we can for intermediate/longer-term sentiment…but we cannot go an hour without reading or hearing somebody tell us that the stock market is going to rally over the short-term. In fact, some of the biggest bears think the market will be fine over the next couple of weeks. With this in mind, we think that Friday’s highs could actually be the top for this bear market rally………..The great thing is that we should know one way or another before the end of next week.
3) Seasonality is something we watch very closely. That said, it is not a perfect indicator at all. In the 4th quarter of most years…especially in midterm election years…the market tends to rally from an October low into the end of the year. However, this is not always true. In fact, during bear markets, we have seen MANY times when the market didn’t act particularly well in Q4.
It is always important to look at seasonality issues. Some of “seasonals” have logical reasoning behind them (like the “January Effect”). Ohers don’t have a lot of logic t
o them at all (like the tendency for the days surrounding Memorial Day weekend to be positive ones). Anyway, one of the best-known ones is the tendency for the market to do well from the October lows into the end of the year…particularly in midterm election years. (In Presidential Election years, the rally tends to start near Election Day in November.)
However, if you look at years when the stock market is in a bear market (like it certainly is this year), the Q4 seasonal trends are turned upside down!
Before we review these examples, we just want you go through a few comments about exclusions and inclusions in this short study of Q4s during bear markets…..We did not include 2020. Yes, the stock market did fall over 35% that year, but the decline took place over a period of just one month…and it was over long before we got to the 4th quarter of that year. Also, we DID include 2018. No, it didn’t fall 20% on a closing basis, but it did on an intraday basis. Besides, a 19.8% decline is close enough…and the 20% number is completely arbitrary. (That rule did not exist when I started in the business.) Thus, we thought it was right to include that stock market decline in our “bear market” study.
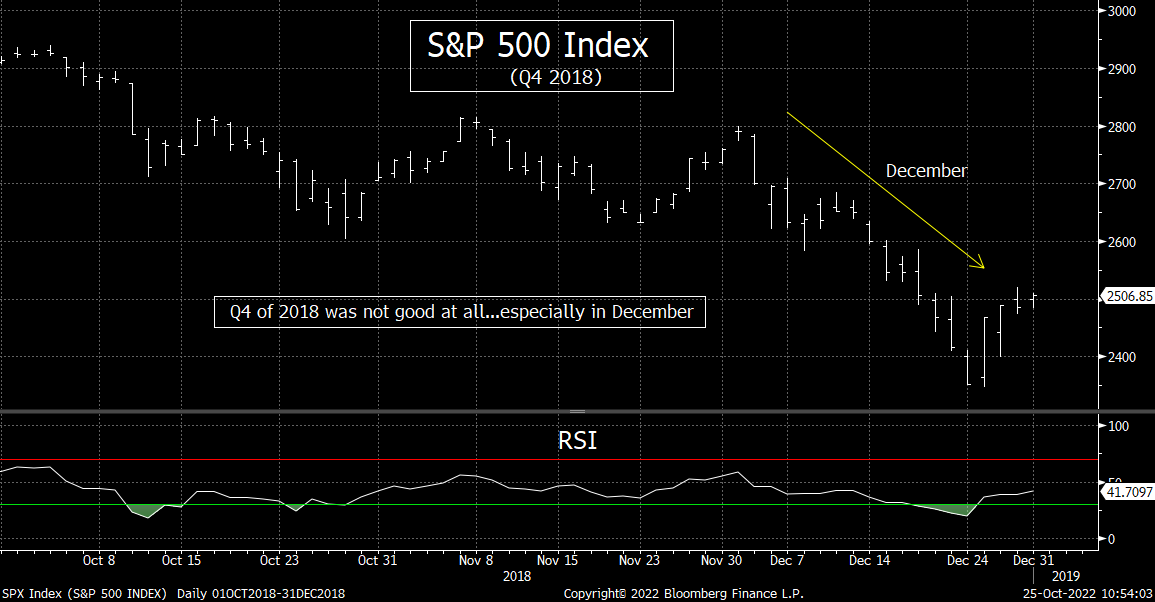
Anyway, in decline of 2018, the S&P 500 fell 14% in Q4 of that year…and was down 20% at its worst level (on Christmas Eve of that year). Needless to say, 2018 was a midterm election year…and Q4 there is absolutely no question that a 20% decline during that quarter qualifies as a HORRIBLE quarter for the stock market (even despite the fact that it was an election year)! In other words, it’s great that so many people talk about how great the seasonality situation is for the stock market right now, BUT the most recent mid-term election year actually sucked for the stock market!!! For all practical purposes, it was a bear market…and the stock market acted very poorly in the 4th quarter of that bear.
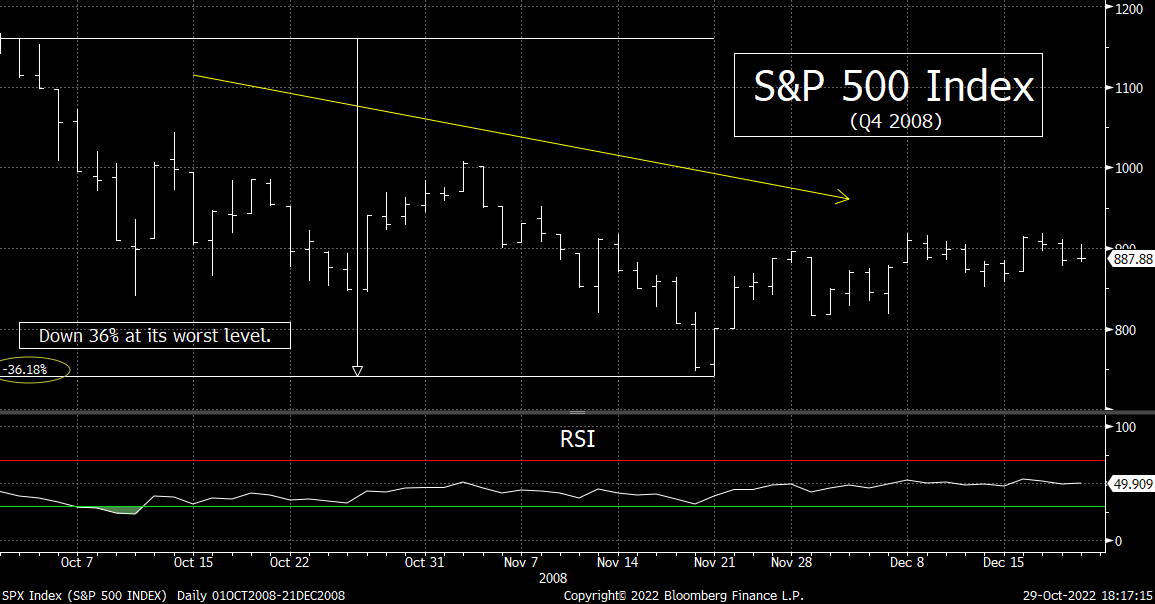
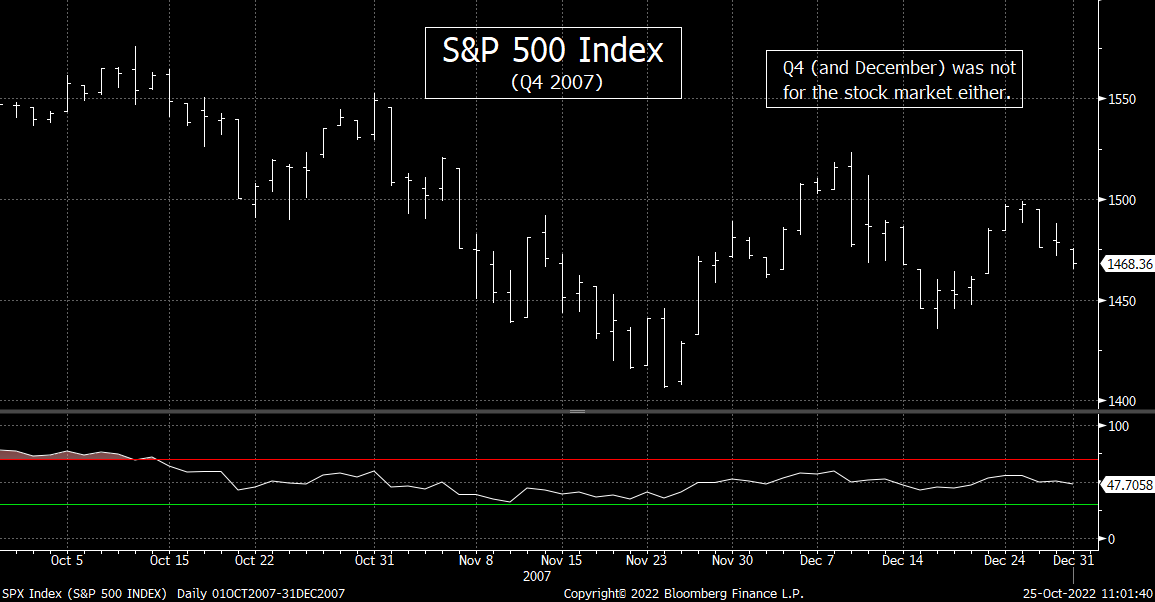
In the previous bear market before 2018, the S&P declined over 22% in Q4 of 2008 and by almost 4% in Q4 of 2007 (the very beginning of that bear market). However, those numbers make the 4th quarter of each of those years seem better than they actually were. In 2007, the S&P was down 20% at one point (from it’s Q4 high to its Q4 low)…and in 2008, the S&P was down 36% at one point!!! Therefore, the stock market saw a VERY SCARY decline at one point in December of those years…and only a sharp bounce very late in the quarter helped them from being total disasters. Therefore, here is another CLEAR example of when the 4th quarter of the year was NOT a good year AT ALL for the stock market. Since it is another example of what the stock market does in the 4th quarter during a bear market…like today…it lowers the argument for “seasonality” argument as we move through the last two months of this particular Q4.
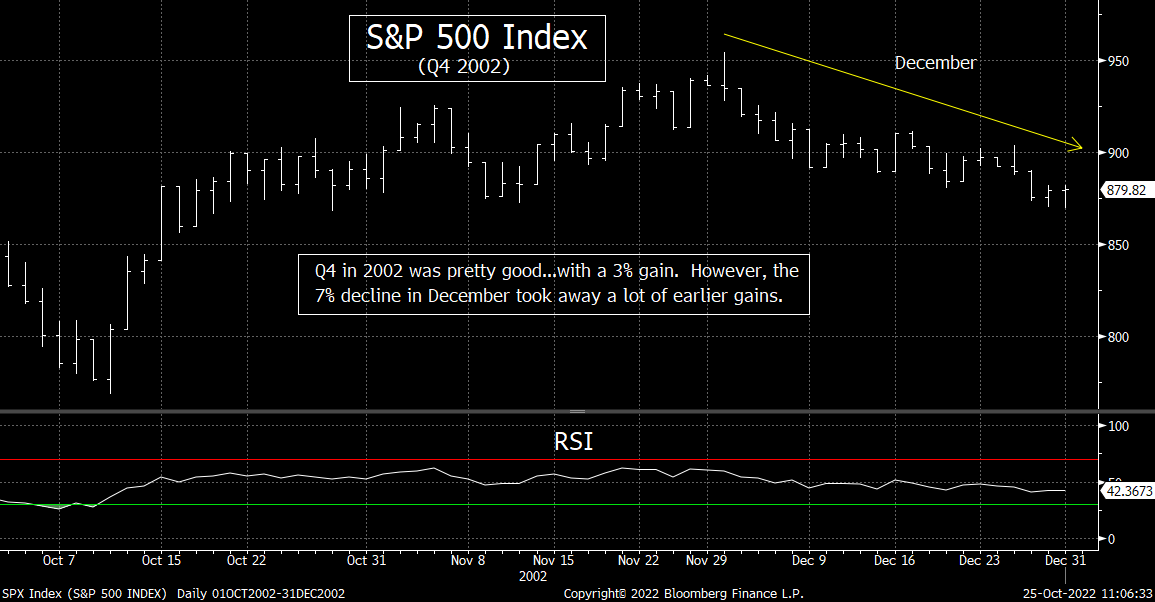
Looking at some other bear markets, although the stock market rallied in Q4 of 2002 during the tech bubble bust, it still saw as a 9% decline in at one point in December that year. Of course, Q4 of 1987 was a horrible quarter…as the S&P retested its October crash lows in December of that year…and closed with a more than 20% loss for the quarter on December 31st. Thus, there are plenty of examples of when Q4 has not been kind to the stock market…when it comes during a bear market.
Having said this, there HAVE been some good Q4’s during bear markets. It’s just that it hasn’t taken place in a very long time. We did see a nice rally in Q4 of 2001…and the same was true in the bear markets of 1990 and in 1981. Therefore, we are NOT trying to say that the stock market ALWAYS declines in the 4th quarter during a bear market. (On top of this, the bear markets of 1987 and 1990 bottomed during Q4 of those years…and never looked back!)
In other words, we’re really saying is that the seasonal factors that usually help the stock market rally toward the end of the year in most years do not work well during bear markets. In fact, they don’t work very well at all…and they haven’t worked at all in a very long time. This does not mean that the stock market will definitely roll-over in a significant way soon, but it DOES tell us that the bulls need to be very careful about using the “seasonality” issue right now…given is doesn’t work very well during bear markets…and give that we are definitely in a bear market right now.
4) Despite the rally in the stock market, the overall fundamental picture got worse last week, not better. A few “less hawkish” comments are not a “dovish pivot:…and neither is a small than expected rate hike. Also, just because one tech giant is doing better than others…does not mean they’re doing well. Finally, the geopolitical equation became much more precarious last week.
The stock market got a boost last week from some less hawkish comments from some global central bank officials (and a small rate hike from one central bank)…as well as better than feared earnings report/guidance from AAPL. However, nothing that those Fed officials said recently (and nothing the BOC did) signaled that the Fed is going to do an actual “pivot” ANY time soon. Also, the report from AAPL was really not very good. It was just better than feared after others reported LOUSY earnings and gave very poor guidance. Finally, the issues on the geopolitical front were very concerning…on several fronts. (This last issue will be discussed more in the following bullet point.)
The stock market seemed to get a nice boost last week some from comments that were made by San Fran President Daly and an article in the WSJ the previous Friday…as well as a smaller than expected rate hike from the Bank of Canada. The comments from Ms. Daly (which we highlighted last weekend) were indeed a bit less hawkish than we’ve heard in the past. However, she did reiterate that she expected the Fed to continue to tighten and that the Fed needs to beat-back inflation. So, the comments were not overly dovish at all.
The article in the WSJ (from the “Fed Whisperer” Nick Timiraos) on the same day hinted that the Fed was going to hike rates at a less aggressive rate after the November meeting…with hikes of 50 basis points in December and 25 basis points in the following two meetings. We understand why people saw this as a “less hawkish” tone…as some people have been worried that another 75-basis point hike was coming in December. However, did anybody really think the Fed was not going to raise rates by a smaller amount in 2023???......Also, we heard an interview with Mr. Timiroas on this past Friday, and he did not sound overly dovish at all when he gave his opinion of what the Fed will do going forward. In fact, he mentioned that the Fed does not want to see a repeat of the summer rally…and that they fully understand that strong rallies in risk assets hurt their goal of tightening policy.
We don’t know how much of a mouthpiece Mr. Timiraos has become for the Fed, but neither his comments…nor President Daly’s comments…gave us any sign that the Fed is about to engage in ANYTHING like the major “pivot” they did in late 2018. In fact, they did not even hint at a “pause.” They merely inserted some language about a throttle back on the size of rate hikes…which should have been pretty obvious would take place going forward anyway!
As we have stated (and shown) many times this year, markets need a major loosening policy from the Fed (zero interest rates, and especially a large liquidity program) to push valuations in the stock market to 1999/2021 levels. A “pause” in the tightening cycle will not do the trick…and smaller size of rate hikes won’t even come close. They need liquidity INJECTIONS (steroids) to recreate the kind of marketplace we saw in 2021…and nothing these people have said indicates that we’re going back to Barry Bonds like programs. The same can be said about the BOC’s announcement…or even ECB Chief Lagarde’s comments (which we didn’t find compelling at all…especially given the off extremely high inflation number out of Germany last week).
Don’t get us wrong. We have said all along that the first signs of a “less hawkish” policy from the Fed would indeed create a short-term bounce in the stock market. Therefore, we are not surprised at all by last week’s reaction. However, we do not believe it is something that will give the market traction throughout all of the last two months of the year. A “pause” is NOT a “pivot”….and “smaller rate hikes” are not even a “pause.”!!!
Another factor that helped the stock market last week…late in the week…was the earnings report out of Apple Computer (AAPL). This is another issue that we do not believe will give the stock market a boost for a very long time. First of all, their earnings were not all that good! No, they weren’t bad, but their revenue numbers only beat the consensus estimates in a very small way. On top of this, iPhone revenue missed the consensus projections…and their all-important services business also saw a very mediocre improvement (with the revenues missing consensus estimates in this area as well).
More importantly, the rest of the week was littered with LOUSY earnings reports and guidance. (As Judge Smails would say, they ssssssssssssssucked!) Google (GOOGL) revealed a materially slowing ad market…Texas Instruments (TXN) echoed what many chip companies have said recently about lower demand…Intel (INTC) announced a major layoff…AMZN and MSFT were among several companies who said the cloud and data spending are falling. This was an area that was supposed to do well come hell or high water!.....We would also point out that even though Visa’s (V) stock rallied nicely on Friday, they said that spending growth has slowed the most since the pandemic. That’s not good news following the increase in write-offs that AXP spoke about the week before.
What we’re saying it that a lot of people got very excited about the reaction AAPL’s stock had to its earnings report on Friday. However, if you look at last week in its entirety, it was a LOUSY week for the fundamental outlook for the U.S. stock market. Besides, given how far AAPL fell on Thursday, one has to wonder if Friday’s action had more to do with people who got caught burned by shorting the stock in front of their earnings on Thursday…especially since the numbers out of AAPL were really nothing spectacular at all.
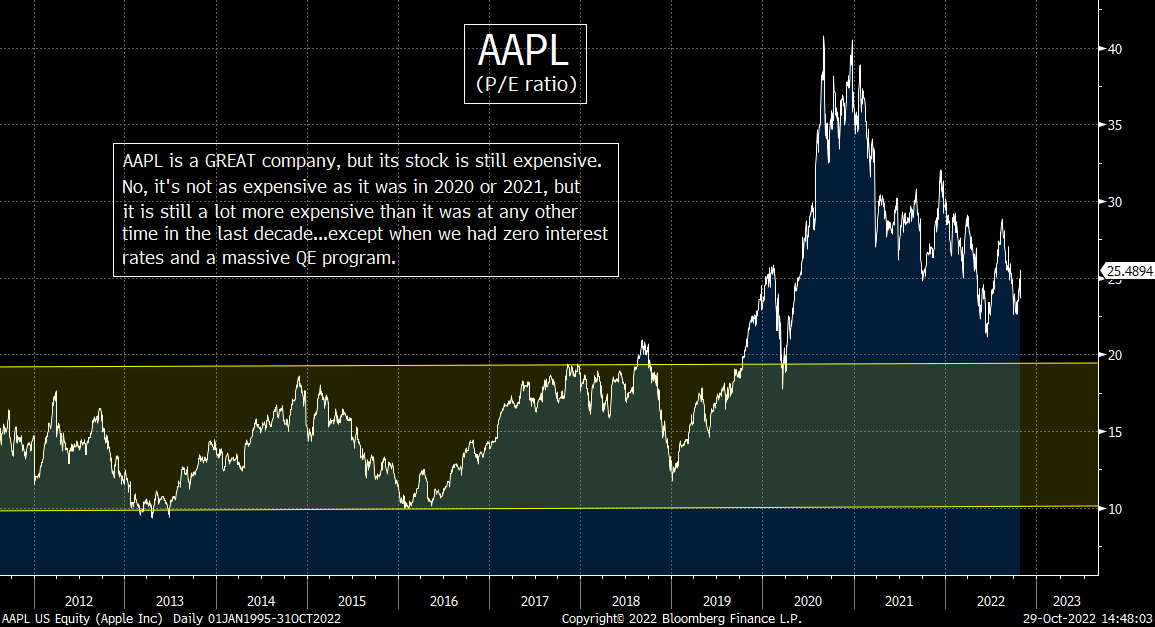
Before we end this bullet point, we want to reiterate what we’ve said MANY times this year. AAPL is a GREAT company…with great leadership…and it’s a stock that everybody should own. We’re just saying that it’s earnings report and guidance were not fabulous last week…and that at more 24x forward earnings, it’s not cheap. When you combine these facts with the guidance we got from MANY other companies last week (especially tech companies)….and then combine THOSE issues involving AAPL with the fact that the Fed is a long way from providing the kind of liquidity that would allow the stock market to trade at elevated valuation levels…you get a situation where the stock market is going to have a very tough time rallying a lot more than it already has recently.
5) A lot of people have been hoping that the reopening of China following the Communist Party Congress would help the global economy bounce back in a material way in 2023. After what we heard (AND what we saw) last weekend, it looks like those who are looking for China to be a positive catalyst for global growth (or anything else) are going to be sorely disappointed.
As the old saying goes, a picture is worth a thousand words. Well, the same is true for a video clip…and the clip of former leader Hu Jintao being forcibly removed from the Communist Party Congress a week ago took this old saying to a whole new level. He also removed all of the reformers from Jintao’s regime completely from the upper echelons of power……Based on what took place in China throughout most of 2021…when Xi clamped down of many different key industries in China, it looks like he’ll be doing the same thing going forward…now that he has consolidated his power in a major way.
We listened to what several experts last week on this subject. Kyle Bass said that an important change was made to Xi’s “work papers” for Party Congress…..by removing the term “reform and opening” with the phrase, “great struggle.” As Mr. Bass put it, Mr. Xi has formed a “war time cabinet”…and removed the technocrats who were running China’s markets. This, he said, is an important signal of what China will do in the years ahead.
Another long-time China watcher and investor, Mark Mobius, said that President Xi is “really showing his power”…and described the results of the Party Congress as one that moved Xi much closer to the Chairman Mao type of model. Mr. Mobius also highlighted the slowdown in Chinese growth…and said that their unwillingness to release economic statistics was very telling….We also found Steve Roach’s comments very interesting…when he said that Xi’s new appointments mean that there is no doubt that China WILL respond to the Biden Administration’s new chip restrictions.
Of course, you don’t have to think about what China is going to do in the future to be concerned. The situation right now is not a good one at all. Their real estate industry is reeling. It makes up 1/3 of China’s economy and home prices are down 10% in many cities…despite efforts by China to prop up that market. As we all know, property developers in China have been in crisis mode for over a year now, so these issues remain a significant headwind for China. With the IMF further downgrading its economic growth projections for this year and next year, there are plenty of reasons to be skeptical about how strong China will be as a global growth engine next year.
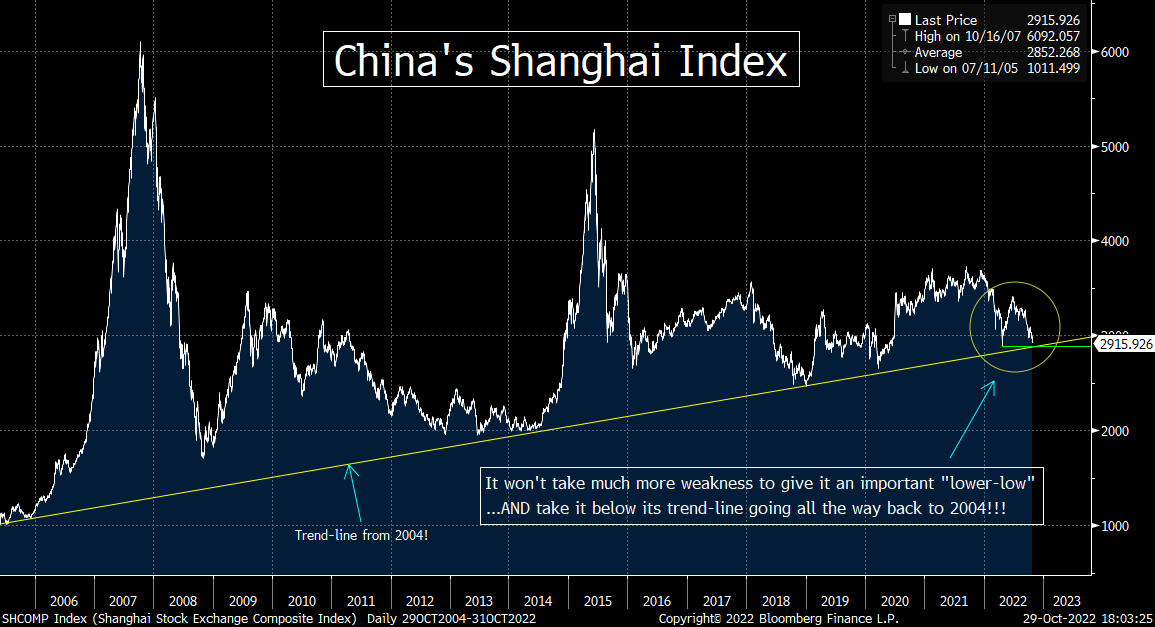
We’ll finish this bullet point by discussing the charts on China’s Shanghai Index and Hong Kong’s Hang Seng Index. First, we’d note that the Shanghai Index has seen important “lower-high/lower-low” sequence on its weekly chart…AND it’s testing its trend-line that goes all the way back to 2004! Thus, any further weakness for this index in the weeks ahead will be quite bearish on a technical basis. (That trend line is also the lower-line of a huge “symmetrical triangle” pattern going back over the past 17 years, but we did not draw it on the attached chart.)
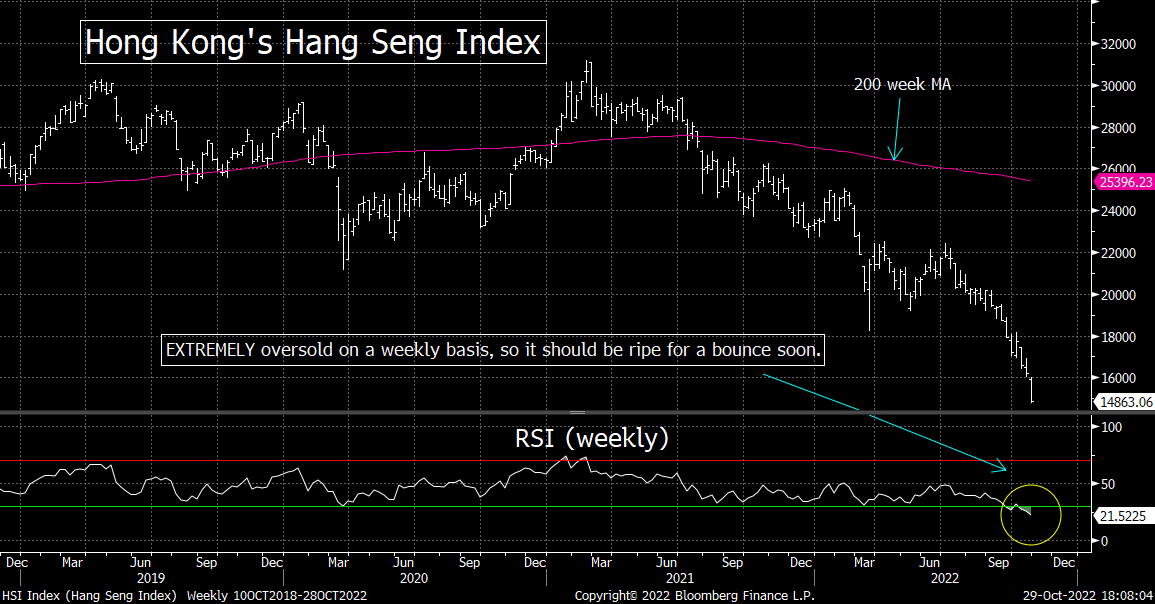
As for Hong Kong’s Hang Seng Index, it has been under tremendous pressure since the party Congress in China. It has declined more than 12% since early October…and it now down over 50% from its 2021 highs! That said, it has fallen so much that it has now become more oversold on its weekly RSI chart than any other time in the past 30 years, except for the lows int 2001 and 2008. Therefore, it could/should be due for a short-term bounce soon. However, given what we have heard over the past 10 days out of China, any near-term bounce in these markets will likely only give them some temporary relief.
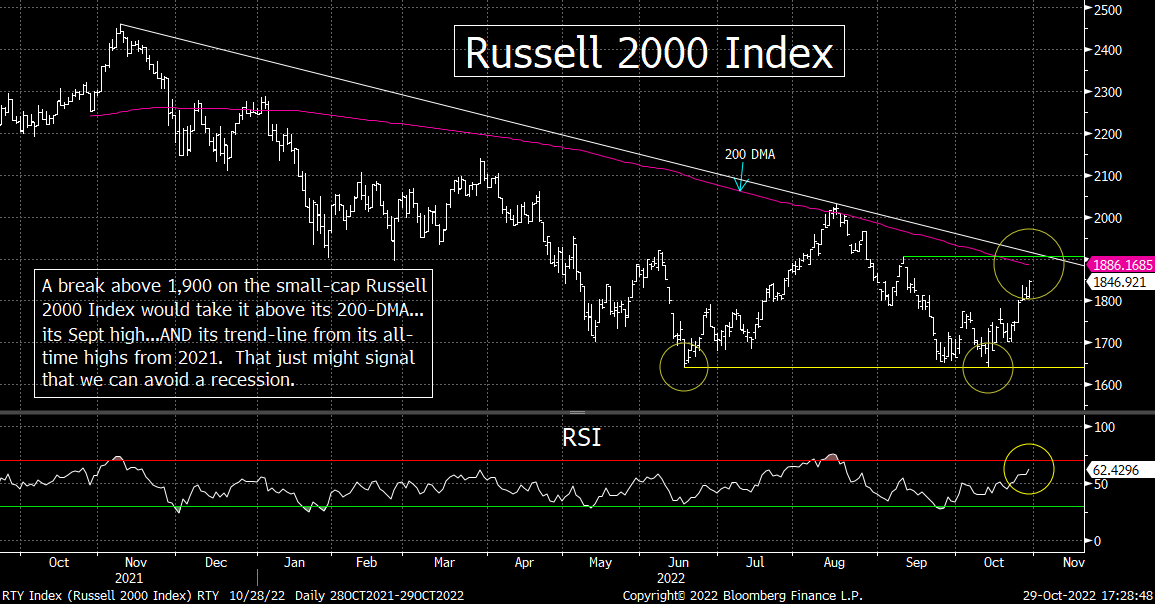
6) What if we’re wrong? What if the economy is somehow going to be able to avoid a recession? If that is the case, the small cap stocks will outperform more than they already have over the past 2-3 weeks. Looking at the small-cap Russell 2000 index, the resistance levels are well defined. If we can break above one particular level on this index it will raise the odds of a much better outcome than we’re looking for right now.
One of the great things about the small-cap stocks is that they outperform when the economy is coming out of a recession…and when the stock market is coming out of a bear market. Well, the small-cap Russell 2000 has outperformed in a mild way over the past 4-6 weeks, so maybe this is sowing the seeds of a better 2023. (That’s not our base case at all…but we want to look at all sides.)
The Russell 2000 did not make a “lower-low” below its June lows in September…like the S&P 500 and NDX 100 did last month. Instead, it made a what could turn out to be a nice “double bottom.” The Russell has outperformed the S&P on its bounce from the late September lows, but only by a very small amount. So, as you can see, the recent outperformance has not been all that big (even though we’ve seen some individual days where the outperformance has been quite large). However, it has outperformed none-the-less, so we want to keep an eye on this important index.
The first level we’ll be watching is the 200-DMA. That line provided very tough resistance in August, so it could/should be a tough nut to crack if it retests that line in the coming weeks…a least on its first try. However, the much more important level is going to be the 1900 level on the RUT. A meaningful break above 1,900 would not only take it above its 200-DMA, but it would also take it above a Fibonacci 61.8% retracement of the entire bear market…AND its trend-line going back to its November 2021 all-time high!.....Given that the Russell made a nice “double bottom” in June and September, a break above this key resistance level would be particularly bullish.
We do need to say that a move above $2,200 would be the icing on the cake. That would take the Russell 2000 above its August highs, but a break above 1900 would be still be a very bullish move……….Finally, on the flip side, if instead of rally further as we move forward, the Russell rolls over and takes out its double-bottom low of 1,650 in any significant way, it’s going to be VERY bearish for the small cap stocks.
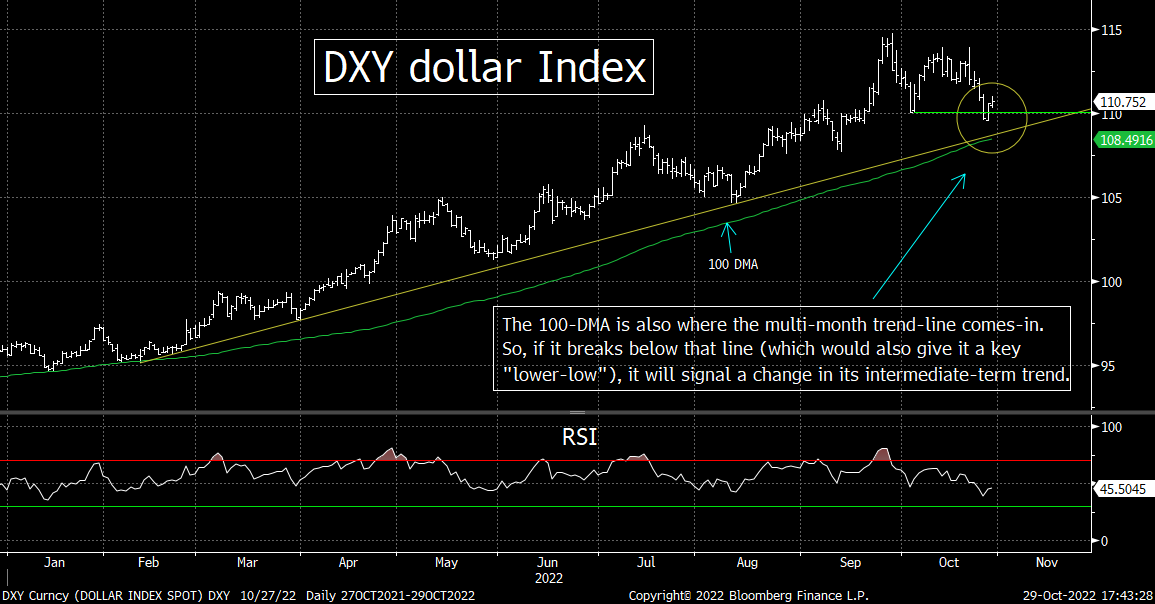
7) The dollar has seen some weakness over the past month or so. It’s not enough to signal a change in trend, but if it falls much further, it will do exactly that. That said, it has bounced off its current resistance line many times, so the odds that it will break down this time are not overly high. However, we will be watching it very closely next week. Any change in trend will have important implications for several other asset classes as well.
As we move forward, it is going to be important that we keep a close eye on the dollar. It sure seems like the dollar has been on a one-way ride higher all year this year. However, it has actually seen several dips during its strong rally this year. Yet, none of these dips gave the DXY dollar index a “lower-low”…until one day last week. We don’t want to make too much of this “lower-low”…because it was only a very, very slight one…and the dollar did bouncing back a bit on the last two days of last week. However, the action in the greenback over the next few weeks should be important. If it can bounce nicely (like it has so many times this year), it will signal that the upside momentum is still intact. If, however, it falls further, it just might indicate that the trend for our currency has finally changed.
The DXY also broke below its 50-DMA yesterday. This is not a big deal. It has broken below that line a couple of times this year…only to bounce back rather quickly. Instead, we’ll be watching the 100-DMA. The dollar bounced off that line a few times in the first quarter of the year…and then bounce from a level just above that line in August. On top of this, the trend-line from the first quarter comes-in right at that 100-DMA as well. Therefore, if the DXY breaks below that area (of about 108.50) in a meaningful way any time soon, it should signal a change in trend for the greenback.
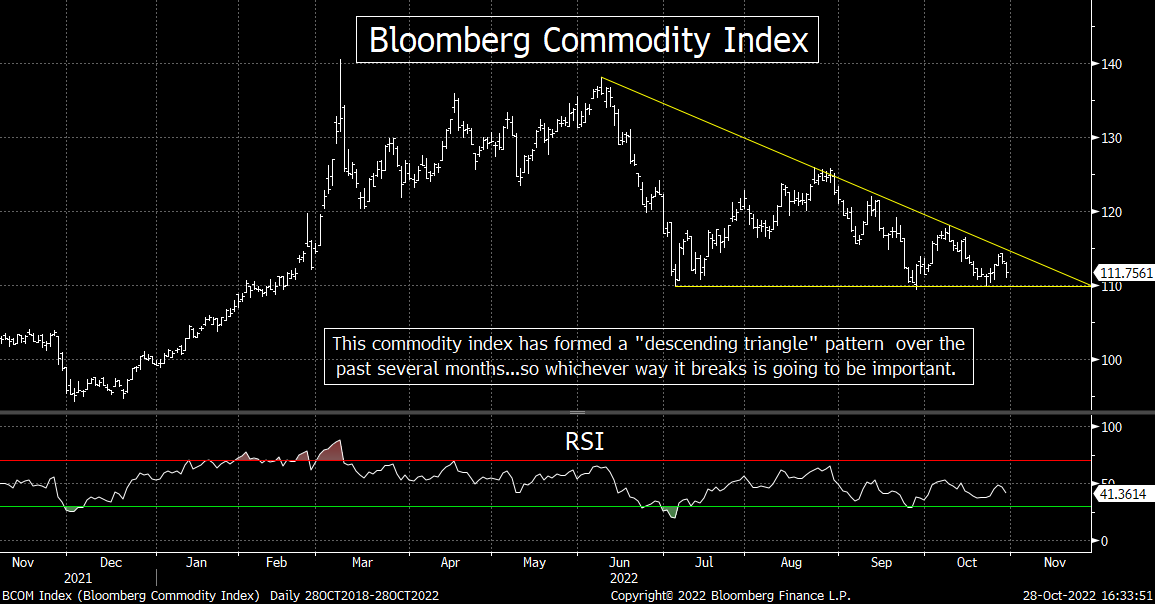
Needless to say, that would have an important impact on many other assets (like commodities and emerging markets). Therefore, it’s something we’ll be watching quite closely……A lot of people are quite sure that commodities will continue to fall in a significant way in the weeks and months ahead. In fact, the Bloomberg Commodity Index is getting close to the bottom line of a “descending triangle” pattern, so if it breaks below that line in any substantial manner, it is certainly going to be very bearish for this asset class. HOWEVER, if (repeat, IF) the dollar sees a change in trend going forward, we could see a surprising bounce in commodities (an emerging markets as well). Therefore, investors will need to stay nimble in MANY different markets for the rest of this year…not just the stock and bond markets!
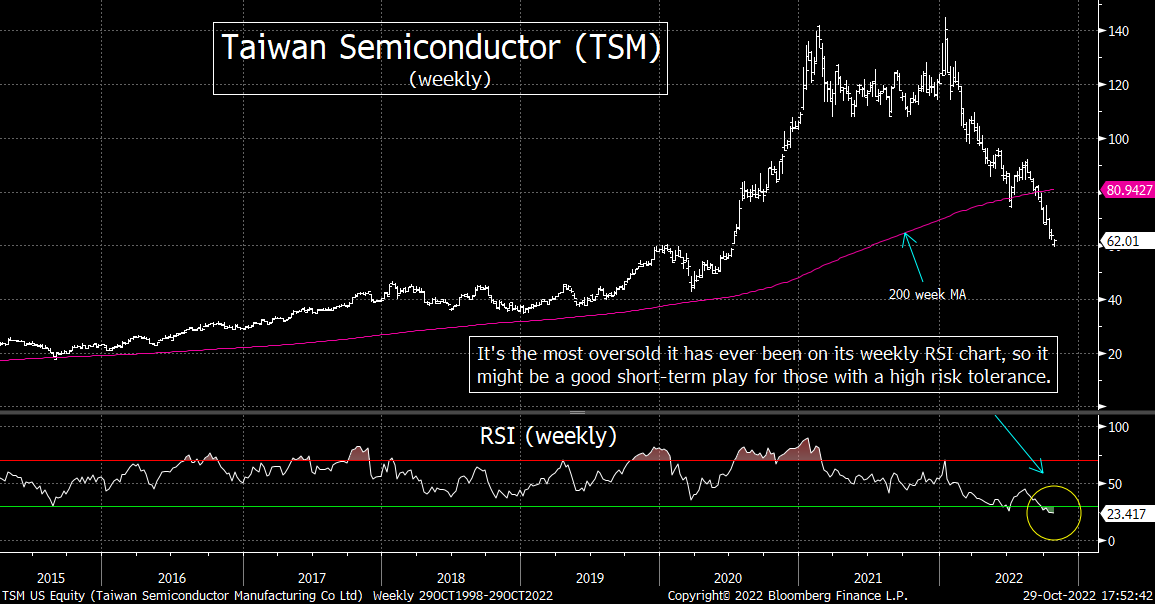
8) We like to show the chart of an individual stock each week. This week is going to be a surprising one. Taiwan Semiconductor has become extremely oversold. We are very concerned about the fundamentals of this industry and we do not see a turnaround soon. There is also the obvious geopolitical concerns that surround this company. However, for those who have a high tolerance for risk, TSM is getting ripe for a short-term bounce that could surprise a lot of people.
Every once in a while, we see a chart on a stock that indicates that it could be a great short-term play…even if its intermediate and long-term fundamental picture is not a good one. Well, we have one this week that takes this to a whole new level. The stock is Taiwan Semiconductor (TSM)…and it has become extremely oversold.
The problem is that we do not like the fundamental back drop for the company at all. As we have seen and heard from many semiconductor firms over the past several weeks (and months), demand for chips is down globally…and since we see a recession on the horizon, we do not see demand reversing any time soon. Also, China President Xi’s comments about Taiwan have only become more bellicose. Although we do not see an Chinese invasion of Taiwan in the near future, the developments out of China’s Communist Congress obviously did not help the situation.
However, on a purely technical basis, the shares of TSM just might be enticing right here. As we highlighted in point #5, the Hang Seng index has become extremely oversold…and we’d also note that Taiwan’s TAIEX Index has become equally oversold. Therefore, they should be ripe for a short-term bounce…even a sharp one…before long. Therefore, if we get a bounce in those indices, it should help TSM as well.
As for the chart on TSM, its weekly RSI chart is the most oversold it has EVER been. Yes, it is more oversold than it was at the bottom of the tech bear market in 2002…as well as more oversold that it was at the bottom of the Great Financial Crisis. It is also trading 26% below its 200-week moving average…which is (by far) it’s biggest move below that line ever.
Based on our opinion that the global stock market and the global economy are both going to weaken further over the next 6-9 months, this would seem to be a crazy stock for us to highlight on the bullish side of the ledger this weekend. However, we have learned several things in our years on Wall Street. One of them is that we could wrong about the market…especially when it comes to its short-term prospects. Second, we have learn a ZILLION times over the years that ANY stock can move in the opposite direction of its fundametnals for many days…and even several weeks…even if it’s going to revert back to its fundamental trend eventually.
With all of this in mind, this is certainly not a stock that we’d back up the truck to buy. Instead, it’s one that people might want to nibble on at current levels…with a tight stop. Those with a very high tolerance for risk might want to consider the TSM call options that go out a week or two. If this stock does indeed catch a bid…even if it’s only for a short while…it could fly in a very surprising way.
9) Politics…..By Matthew J. Maley Jr……In many cases, traditional American politicians have neglected the needs of the American electorate over the past decade or more. In their desperation, Americans will turn to any politician who is committed to addressing their concerns and speaks for their needs. The average American is far less politically polarized than the media might suggest. Many of them simply want their voices to be heard.
Hello all – The countdown to Election Day just hit single digits, to the relief of many overworked politicos. The final days of a campaign are some of the most emotional and memorable for anyone who has spent time in campaigns. Months of work culminate in one massive crescendo that can have enormous implications for one’s career and the country.
Sometimes the outcome of an election is as surprising as it is difficult to accept after a long and arduous campaign. Such was the case for Democrats in 2016, who had expected to celebrate the elevation of our nation’s first female President. To some observers, Donald Trump’s ascension to the Presidency was simply inconceivable. For over a year leading up to Election Day, the talking heads of the national media had insisted that such an outcome was categorically impossible. However, to those who had spent time on the ground talking to voters, such an outcome was far less surprising.
Donald Trump carried a whopping 206 counties in 2016 that had previously voted for Barak Obama in both 2008 and 2012. Such a phenomenon baffled many Washington insiders and straight-party voters who would never consider voting for someone from the other party. However, to this recent college graduate in 2016, nothing could have been more glaringly obvious from what I saw on the ground at the time.
That’s not to say that I was or am a Trump enthusiast. Far from it. My first full-time job out of school was as a Republican canvasser in Fayetteville, North Carolina. I knocked on doors, made phone calls, and organized rallies for Republicans up-and-down the ticket. One of which was Donald Trump. I was ambivalent about hitting the campaign trail for such a polarizing figure. However, I was confident in Donald Trump’s defeat and felt this was an excellent opportunity for an eager politico with zero experience. So, I packed my bags and headed to North Carolina.
Cumberland County, North Carolina is as emblematic of a southern working-class town as it gets. The city of Fayetteville proper boasts an African American plurality and is home to the largest military instillation in North America, Fort Bragg. To say this was a culture shock for a 22-year-old from the Boston suburbs would be a massive understatement. Something that I’m eternally grateful for six years later.
Schlepping along the streets of Fayetteville in the sweltering southern heat is a monumental exercise in character-building for a recent graduate of a small liberal arts college in the northeast. Some of the horror stories are too stressful to recount. I was heckled by voters from the other party, harassed by dogs, and received a crash course in regional southern insults. But what surprised me most about this experience wasn’t how many people hated us Trump canvassers – it was how many people welcomed our presence as a breath of fresh air at the time.
People of all backgrounds seemed desperate to talk about the brash New York businessman who was demolishing the status-quo of American politics. Looking both ways and whispering under their breath, “Do you think he’s got a chance?” was a common refrain for many Fayetteville voters while we chatted on their front porch. I was stunned by how many women and people of color expressed excitement about Trump’s candidacy. The news media had assured me that those were the people most afraid of Trump and the MAGA movement. Instead, they seemed like his biggest supporters. I remained skeptical until Election Night 2016, when I watched state after state fall into the Republican column and send their electoral votes to Donald Trump.
Today, many political observers attribute Donald Trump’s popularity to the rising tide of right-wing nationalism. While there are CERTAINLY people who support him for that reason, that analysis fails to consider some of the other factors in the political landscape. While it looks increasingly likely that Donald Trump will make a third bid for the Presidency, socialist politicians like Bernie Sanders are also gaining major traction with their own party. Are we to believe that Americans are simply becoming either socialist or jingoist?
To most observers, the answer is yes. However, my time in campaigns has told a different story. Americans are desperate for solutions to problems that have dogged them for years…sometimes decades. I talked with one Fayetteville voter in 2016 who was traditionally a Democrat. He discussed how proud he was that the Democratic party was empathetic to the plight of migrants who came to the United States in search of a better life. However, he also lamented that he had worked at the local Michelin tire factory for almost two decades and hadn’t received a raise that kept pace with inflation in his entire career. He wondered why Hillary Clinton was so focused on helping immigrants, but failed to discuss the needs of American workers?
Washington insiders may not understand why someone would cast their ballot for Barak Obama one year and Donald Trump the next. Many of us rarely spend time in the south, the heartland, or so-called “flyover country.” In many cases, traditional American politicians have neglected the needs of the American electorate. In their desperation, Americans will turn to any politician who is committed to addressing their concerns and speaks for their needs. They don’t care if this person is a socialist, a libertarian, or an orange-skinned TV personality with zero government experience. The average American is far less politically polarized than the media might suggest. Many of them simply want their voices to be heard.
I hope you found this take on the status of the American electorate interesting. My intention is not to advocate for President Trump or for any political figure. Instead, I hope to reframe the reasons why our political landscape has become so jumbled and confusing, rather than simply labeling a broad swath of our electorate as ignorant or hateful. Please stay tuned for next week’s piece when I’ll dive into the final developments of the 2022 elections.
(Matt Maley Jr. has worked for elected officials on both sides of the aisle…including a U.S. Senator, a Member of the House of Representatives, and a Governor of a very large state. You’re not going to find a more even-handed person in Washington D.C.)
10) Summary of our current stance……It was pretty amazing to see how the narrative changed on Friday of this past week. An earnings report out of Apple Computer (AAPL) that really wasn’t all that good…caused many to declare that the bounce that started earlier this month is one that will last through the end of the year…and might even signal the end of the bear market……..We see this kind of response from around Wall Street quite often. When a company reports mediocre earnings, but the stock rallies in a big way, the narrative immediately says that it must have been a good number, because the stock rallied so strongly. (Of course, the opposite is true when a solid earnings report is followed by a sharp decline.)
The problem is that this kind of thing can happen sometimes…when it really isn’t signaling anything at all. Sometimes, a stock can move a certain way for a very short period of time…for no good fundamental reason at all. Sometimes it’s very oversold or overbought…and sometimes the positioning is skewed strongly to one side or another (and sometimes, it’s both).
We believe that Friday’s 7% rally in AAPL falls into this category. Don’t get us wrong, the earnings report was solid. However, their revenue numbers only beat estimate in a very small way. iPhone revenue missed the consensus projections…and their all-important services business also saw a very mediocre improvement…and the revenue number in this area also missed the consensus estimates. Therefore, it was not something that justified such a strong rally. Besides, when you step back and look at the week we had in terms of tech stocks overall (TXN, MSFT, GOOGL, META, AMZN, etc.), it was a miserable week on the fundamental side of things…..In other words, even though some are saying that it’s great that we seem to be avoiding an earnings apocalypse overall, we sure don’t seem to be avoiding one in most of tech land.
Our biggest concern right now is that no matter how much good or bad earnings have been…or are going to be…this earnings season, the guidance we are getting from too many companies tells us that 2023 is going to be a much tougher year. Some companies…especially in the semiconductor area…admit that demand has weakened considerably. Other companies have tried to put on a good face, but when they have been pushed in their conference calls (as some auto execs were pushed), they admit that 2023 is going to be a tough year. On top of this, we’re seeing more and more signs of lower consumer demand. Two weeks ago we heard that FDX is going to have is softest holiday season ever! Heck, even almighty AAPL has stated that demand for their iPhones will fall into 2023……..We’d also note that the University of Michigan’s Consumer Confidence number on Friday included a drop in the “expectations” component…which has it at a level that has only been lower during the financial crisis…the European crisis of 2011…and early this past summer.
Of course, we are also seeing signs that China’s big growth engine continues to stall. Given that this area of the world is something that many bulls have been pointing towards as a source of growth in 2023, these new projections are a big concern. President Xi has filled the government leadership with hard liners…and (very publicly) removed pretty much all of the reformers. Therefore, the big reopening of that economy that many are looking for has quickly become something that is a long shot.
This past week, the 3-month/10-yr yield spread turned negative…and thus it confirmed the inverted yield curve that has existed for many months in the 2yr/10yr spread. Some pundits pushed that aside, but its track record for predicting recessions is a very strong one. Therefore, the process of moving from a strong focus on inflation…to one that focuses on recession…is beginning to take hold. It is not showing up in the stock market yet, but it IS showing up in the bond market. Since a reversal from a rising long-term rate environment…to falling LT rate environment is something that takes place LONG BEFORE the stock market bottoms in a bear market…the revelation that 2023 is going to be a recessionary year should begin to weigh on stocks before long.
Matthew J. Maley
Founder, The Maley Report
TheMaleyReport.com
matthewjmaley@gmail.com
Although the information contained in this report (not including disclosures contained herein) has been obtained from sources we believe to be reliable, the accuracy and completeness of such information and the opinions expressed herein cannot be guaranteed. This report is for informational purposes only and under no circumstances is it to be construed as an offer to sell, or a solicitation to buy, any security. Any recommendation contained in this report may not be appropriate for all investors. Trading options is not suitable for all investors and may involve risk of loss. Additional information is available upon request.