
The Stock Market Stands at a Key Short-Term Juncture, But it's Still a Bear Market Rally.
The major averages are bumping up against key resistance levels. If they're broken, it will be bullish near-term. However, without "free money" and "steroids" (QE), this rally is destined to fail.
Table of Contents:
1) Today is much like the early 2000s…and that severe bear market did not involve a deep recession.
2) When inflation & LT yields turn down after a big/sustained rise, it’s actually bearish for stocks!
3) The dollar is on the cusp of an important trend-change. What will that mean for other markets?
4) Gold is in a new bull market, but it’s very overbought near-term.
5) The S&P 500, NDX 100, & Russell 2000 are at or close to key resistance levels. Can they breakout?
6) Bitcoin is very overbought near-term…and its rally (& the bounce in BBBY) remind us of this past summer.
7) The SMH chip stock ETF is also very close to an important resistance level!
8) GE is becoming extremely overbought after its 66% rally in just 3.5 months.
9) The era of free money is over. Now it’s time for “multiple normalization.”
10) Summary of our current stance.
11) I will be presenting at the MoneyShow's Virtual Expo this Tuesday (Jan 17).
1) The stock market had a very good week last week…and it has given the charts a much better look. Thus, we might see some more upside movement in the coming weeks. However, we still believe that this bear market is not over yet. If there’s one item that we believe the bulls are using that we think is misguided is the thought that a soft landing or the avoidance of a recession will be enough to prevent a further decline in stocks. It won’t. Today’s stock market is too much like it was after the tech bubble burst for that to happen.
As you will see in later bullet points…when we discuss the charts on the S&P 500, the NDX Nasdaq 100, the Russell 2000 and the SMH semiconductor ETF…there are reasons to think that the stock market could rally further (maybe materially further) before the rally ends. If these indices/ETF’s can rally much further from here, it will take them above some key resistance levels…and that could/should lead to the kind of advances that will shift sentiment in substantial manner. However, as you will also see from our discussion today, we do not believe it will signal the end of this bear market. It will only provide the kind of horrible head fake that will burn investors even more in 2023 in our opinion.
However, before we turn to these subjects, we want to highlight that we believe that it won’t matter as much as most pundits think right now if we get a soft landing or avoid a recession. In other words, the stock market will still have further to fall even if we’re able to go through a massive de-risking/de-leveraging process with only a mild/short recession.
The reason we believe this is because what we are facing today is very similar to what we faced when the tech bubble inflated in the 1990s…and then eventually burst. That time frame (the early 2000s) involved a VERY MILD recession. In fact, it was one of the mildest recessions on record…and yet the S&P still fell over 50% and the Nasdaq decline 80%. The reason the stock market fell in such a sizeable manner in the early 2000’s…even though the economy only slowed in a mild way…is that the stock market had become so incredibly overvalued going into that bear market. This is exactly what took place in 2020-2021…and the entire situation evolved in a very similar fashion.
In the mid…and especially the late…1990s, a massive amount of liquidity was injected into the system to fix the Y2K problem (and to keep people from panicking and taking their money out of the bank all at once). THIS is what caused the stock market to rally endlessly…and to reach absurd valuation levels. It was NOT the belief that we were in a “new economy.”……….This time around, it was the massive level of liquidity that was injected into the system to save the global economy from completely shutting down during the pandemic that took valuations to new highs. It was NOT the incredible new money-making innovations that so many companies were promising. (Just like the late 1990s, many of these new innovative companies are never going to make as much money as they promised. Many will never turn a profit.)
Thankfully, the latest push to absurd valuations (the latest bubble) did not take those valuations as high as they did in the late 1990s. So, hopefully, the decline in the markets won’t be as large. However, they STILL have to come back down to levels that are considered fairly valued…and those levels are below today’s levels…EVEN if we can avoid a recession. (If we DO get a recession…which we believe is quite likely…the further decline is going to be quite ugly.)
We could talk a lot about the differences between today and the early 2000s. We could talk about how debt levels dramatically higher than they were 20 years ago. Thus, we could argue that the odds are low that we can have another very mild recession this time around. However, for the purposes of this argument, we’ll assume that a soft-landing CAN be reached.
However, our real point is that it won’t matter. Either way, given how similar today is to what we went through about 20 years ago, investors should not take any solace in the thought that we can have a soft landing or a mild recession. When you take away massive levels of liquidity in the way it’s being done today, it’s going to weigh on the markets until they are no longer valued at elevated levels…no matter what happens in the economy. That’s what happened in the early 2000s…and that’s what’s going to happen in 2023.
2) One of the newest mantra’s on Wall Street has been a shift away from, “Don’t fight the Fed”…to “Don’t fight the bond market.” This might be the right way to look at today’s situation in fixed income securities, BUT we believe that this is NOT a good reason for investors to become bullish on the stock market…even after the recent early-2023 rally. When interest rates roll-over…and inflation declines…at this point in the cycle…it’s usually quite bearish for stocks, NOT bullish!
We have heard/read that several very well-respected pundits are saying that we need to ignore what the Fed is saying right now…and focus on what is taking place in the bond market. In other words, even though the Fed continues to tighten monetary policy, many people believe that the Treasury market is telling us that they will have no choice but to end that tightening policy soon…and start to become more accommodative (by engaging in a full pivot…and cut interest rates) before too long (by summertime).
We are not convinced that this will be the case. We DO think the Fed will stop raising interest rates soon, but we wonder if they’ll really start cutting rates as quickly as the pundits are thinking right now. Even if the Fed DOES cut start cutting rates as soon as some of these pundits are looking for (and sooner than we’re thinking right now), we still believe that it won’t happen until the stock market falls a lot more than it already has to date. (In other words, the Fed’s decision on when to “pause” will likely be “data dependent,” but the decision on when to “pivot” will likely be more “market dependent”…given how expensive the stock market remains today.)
Before we move on, we want to highlight that although many people are saying that the Fed will have to become accommodative much more quickly than the Fed is indicating right now, not all of them believe this will be a bullish development for the stock market. Jeff Gundlach, for instance, is not bullish on the U.S. stock market. Even though he sees the bond market as a great buying opportunity for investors, he does not see it as something that will help the U.S. stock market to rally. He likes some foreign markets and emerging markets much more.
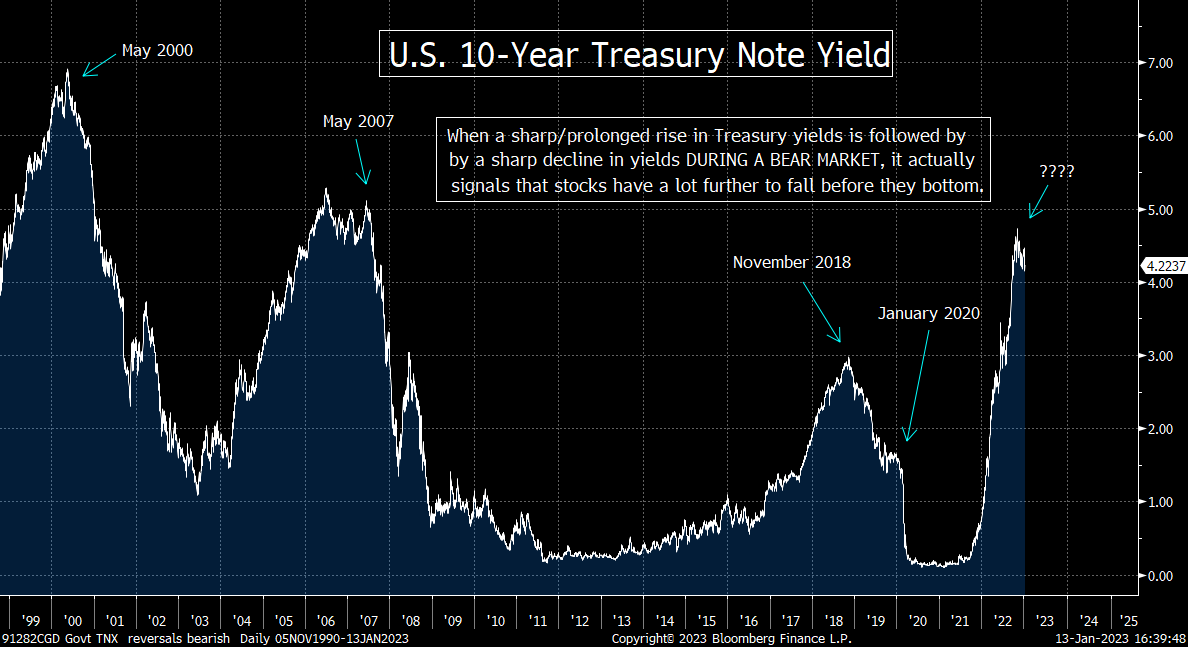
We agree…and history bears us out. If you look at today’s situation…and compare it to similar situations in the past…it actually shows that the fall in inflation and the decline in interest rates at this point in the cycle is actually BEARISH for the stock market. Just look at the two charts below. The first one is a chart we’ve shown in the past. It shows that when interest rates rollover from a serious/long-lasting rise in interest rates…it signals a significant slowdown in economic growth (and usually a recession). Since a serious slowdown in growth (and/or recession) always involved a decline in earnings, it also always includes a further decline in the stock market!
To be more specific, in May of 2000, May of 2007, November of 2018 and January of 2020…interest rates rolled over in a significant way… after rising sharply for an extended period of time (not just rising for a few months). Each time, the stock market declined substantially…AFTER the big shift in trend for long-term rates took place! (After the 2000 & 2007 tops, it fell more than 40%...after the 2018 top in rates the SPX fell 18%...and in the 2020 example, it dropped over 30%.)………As the bond market sniffed out the upcoming recession/slowdown…that would give us lower earnings growth (and an outright earnings decline in most cases), interest rates and stock fell IN TANDEM in a significant way.
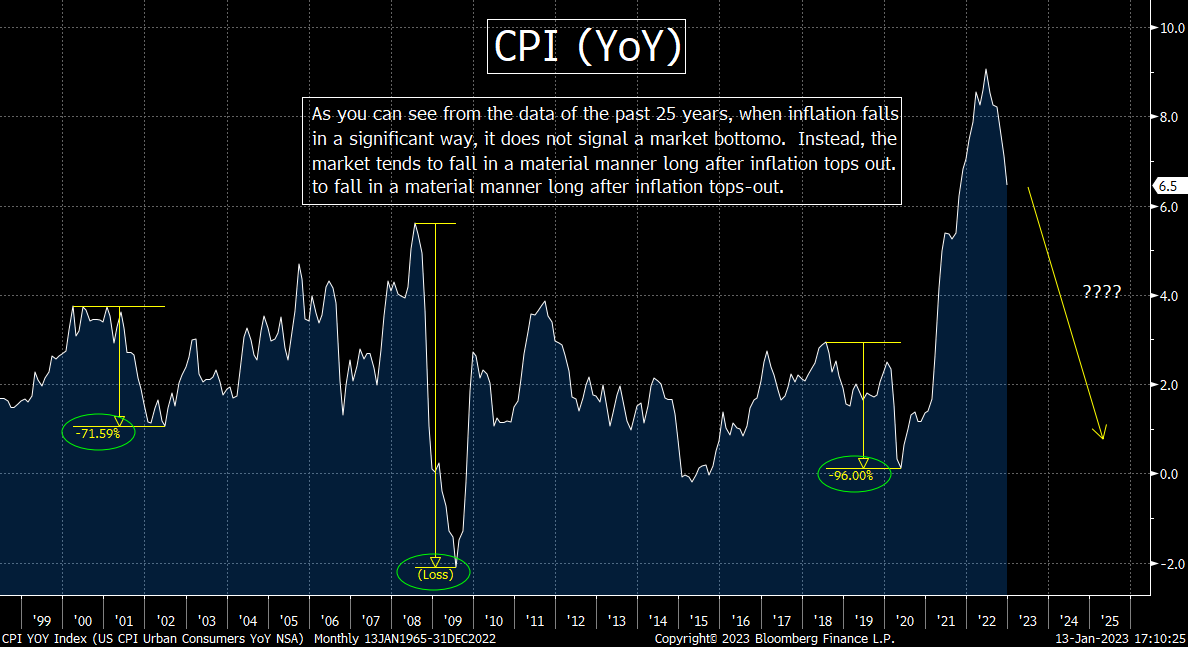
The same has been true for inflation over the past 25 years. Yes, a top in inflation was associated with stock market bottoms in the last 25 years of the 20th century (when many of the textbooks were written). However, if you look at the second chart below, it shows that whenever the YoY CPI number has rolled over after an outsized rise in the last 25 years, it has been followed by a (further) decline in the stock market! In 2000, CPI topped out in Q1. No, it did not start to actually decline until June of 2001, but the stock market still fell a lot more after June of that year. In the second example, (at the end of that decade), the CPI number topped out and rolled over in July of 2008…but the stock market fell another 44% before it bottomed. In June of 2018, inflation rolled over once again, but the S&P still fell 18%...and the same was true in January 2020, when the stock market fell 35% after the CPI number rolled over in a significant way.
Of course, each example has its own individual issues surrounding the declines in inflation…and there ARE some examples where inflation has come down significantly, but the stock market has not fallen in a broad manner over the last two decades. However, the examples of when the stock market has held-up when inflation has fallen dramatically (in 2006 and 2011-2012) occurred when the stock market trading at 14x earnings (2006) and 12x earnings (2011/12)…not almost 18x earnings like it is today.
What we’re saying is that even though a reversal in interest rates to the downside has USUALLY been positive for stocks over the past 50 years, that’s only because it usually happens after only a short-term rise interest rates (4-8 week)…and during a bull market in stocks. However, when the reversal in interest rates to the downside takes place after a strong and extended rise in interest rates (more than a year)…and during a bear market in stocks (both which are true today)…it pretty much always signals a much further decline in the stock market is still in front of us.
No, the correlation is not quite as strong when it comes to inflation, but it still exists when the stock market is quite expensive (like it is right now). Therefore, investors should be careful about assuming that if (repeat, IF) the pundits who are calling for interest rates and inflation to continue to fall in a big way are correct…they are also correct about their bullish stance on the stock market.
History tells us that when we’re facing the circumstances we’re facing today, the correlation between interest rates and stock prices is a STRONG one…NOT a strongly inverse one. If the rise in rates in 2021 had been a mild one…and had only lasted a few months…our argument would be a poor one. However, since the rise in rates was a huge one…and lasted over a year…the reversal in rates is a sign of a weaker economy going forward…weaker earnings growth…and thus a weaker stock market.
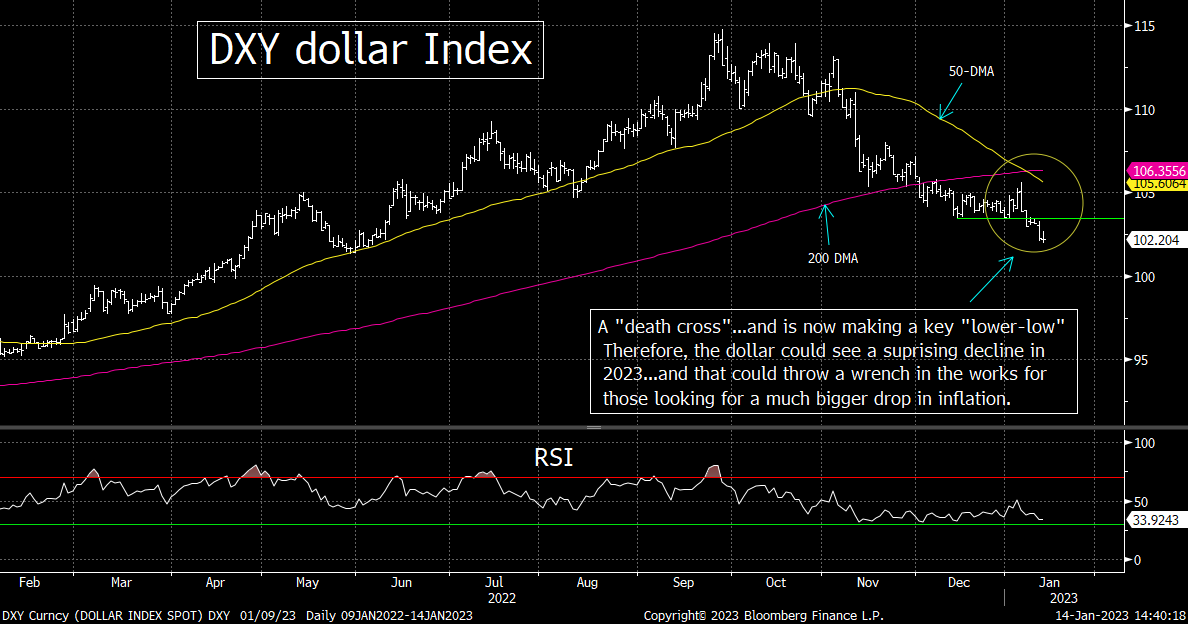
3) The DXY dollar index has broken below the key support level we have been talking about for some time now. So, unless it reverses in a significant and sustainable way very soon, it’s going to signal an important trend for the greenback. That should be bullish for commodities and emerging markets…but not so good for U.S. stocks if it entails global investors rotating towards other global stock markets…and away from the U.S. stock market.
We have been talking about the weakness in the dollar for almost two months now…and this theme is finally catching-on like wildfire. Since we reiterated our concerns about the dollar’s weakness early last week, the DXY dollar index has seen its 50-DMA fall further below its 200-DMA (so the “death cross” has become more compelling)…and the index itself has broken below the key 103 level that we highlighted several times recently. The move below 103 has become a somewhat meaningful one over the last several trading days, so it is raising a big yellow warning flag on the dollar. We do need to point out that the drop below the key 103 level has only been a two-day phenomenon, so if the dollar can bounce back sharply…and see a sustained rally…the warning flag will come down. However, it won’t take much more weakness (nor much more time) to confirm an important change in trend.
If (repeat, IF) we get a confirmed change in trend for the dollar, it will have some important implications for many markets. It would be bullish for the emerging markets…and quite bullish for commodities. THAT, in turn, would put a dent in the argument that says inflation will fall in the coming months…to the same degree it has in recent months. It would also raise the specter of stagflation once again…something that seems to have lost its schtick lately.
Of course, some people will say that a weaker dollar will be bullish for the stock market. Well, we do admit that the stronger dollar last year was quite bearish for the stock market, so a weaker dollar just might be bullish. (It will certainly help the earnings for multi-national companies.) However, we have to point out that the historical relationship between the dollar and the stock market is a very mixed one. Sometimes there is a strong inverse correlation (like we saw in 2022)…but sometimes we see a strong correlation. Sometimes, there is a change in money flows among global markets…and that can cause the dollar & the U.S. stock market move in the same direction.
We wonder is this is something we just might see in 2023. The European stock markets have outperformed the U.S. stock market since the end of Q3. The S&P 500 is up 11% since then…while the STOXX Europe 600 Index has rallied 16%! Germany has faired even better…with a 24% rally since the end of Q3…and France’s CAC index has jumped 21%. With Goldman cancelling their call for recession in Europe, this outperformance could continue in the coming months……..We’d also note that the EEM emerging market ETF has rallied more than 18% over that time frame (and more than 20% from its October lows).
Therefore, we’ve got to think that many global money managers (including ones in the U.S.) have got to be at least thinking about shifting the weightings in their portfolios. Sure, the U.S. has outperformed in a big way for a long time, but if it looks like that is beginning to change in 2023, a lot of institutional money managers are going to have to engage in some serious rotation in their portfolios. If this involves a rotation away from the U.S., it’s not going to be good for the dollar…nor for U.S. stocks. With this in mind, investors should be careful about assuming that a weaker dollar will be good for U.S. stocks in 2023.
4) Our bullish call on gold continues to work out quite well…and we got some more bullish developments on the technical side of things last week. However, we do have to admit that the yellow metal is getting overbought and over-loved on a very-short-term basis, so it could be due for a near-term pullback soon. Therefore, we think investors can wait a bit before they get aggressive on this precious metal once again.
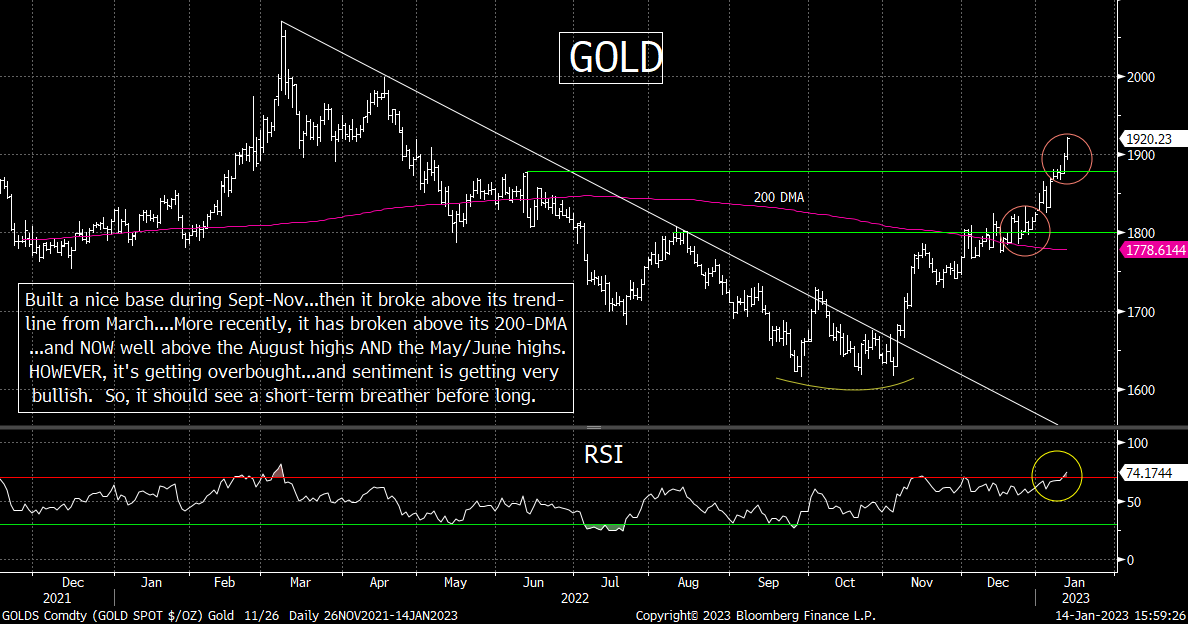
Gold had another great week last week…and we can add two more bullish developments to the list that has been building for several months. In previous pieces, we have already highlighted that the yellow metal formed a very nice “base” back in September-November. We have also pointed out that since November, gold has broken above its trend-line from its 2021 highs…AND broken well above its key resistance level of $1,800!
However, gold saw two MORE bullish developments in the past week. First, it broke above its May/June highs…go give it yet another key “higher-high.” Second, it has also seen a “golden cross”…with its 50-DMA crossing above its 200-DMA. (We do need to point out that it’s technically not an official “golden cross” because the 200-DMA is still falling…and you like to see both lines rising when the “cross” takes place. However, we’d also note that we saw the 50-DMA cross above a falling 200-DMA in both early 2019 and in 2017…and gold continued to rally in a major way both times. Thus, we’re not overly concerned about the fact that the 200-DMA has not turned up yet. When it does, however, it will be yet another bullish development.)
HAVING SAID ALL THIS, gold is becoming quite overbought and over-loved on a short-term basis. This does not change our bullish stance on the yellow metal on either an intermediate-term basis or a long-term one. However, with its RSI chart getting overbought…and the sentiment among futures traders reaching 92% bulls as of Friday night…we think investors and traders alike should look for a pullback in gold that lasts for more than just 1-3 days. Don’t get us wrong, gold could rally a little bit more…and reach even bigger extremes on these readings before it takes a breather. So, we’re not saying that gold is going to rollover in a big way next week. However, it IS getting ripe for a breather very soon, so we think people should avoid chasing this commodity over the near-term. Instead, look for near-term weakness to add to positions.
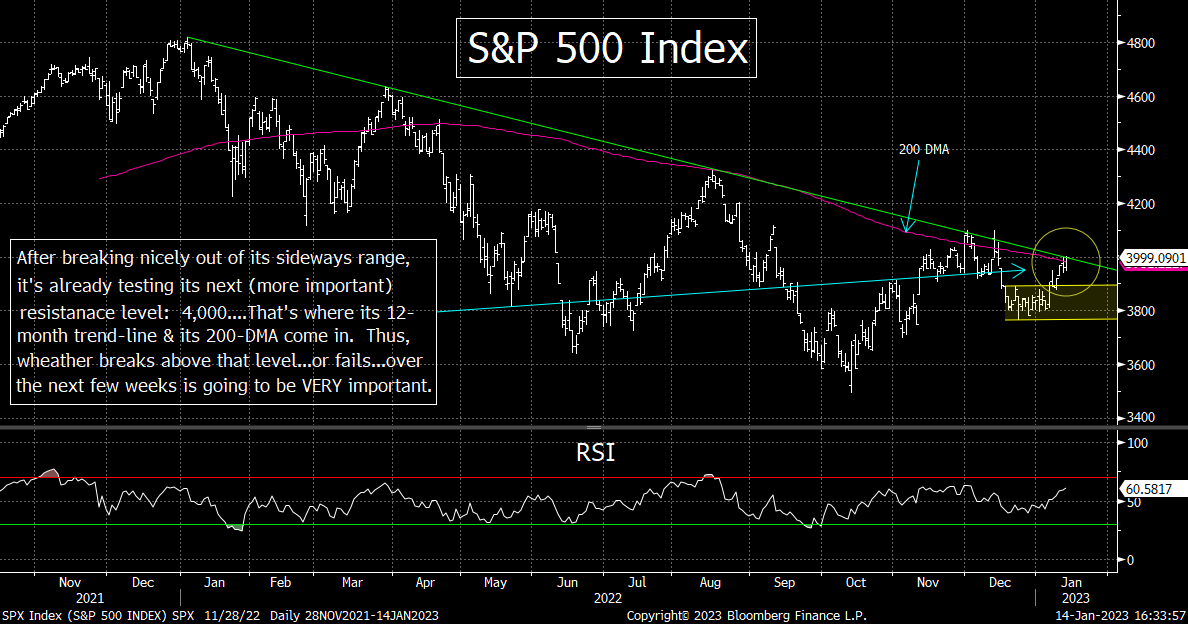
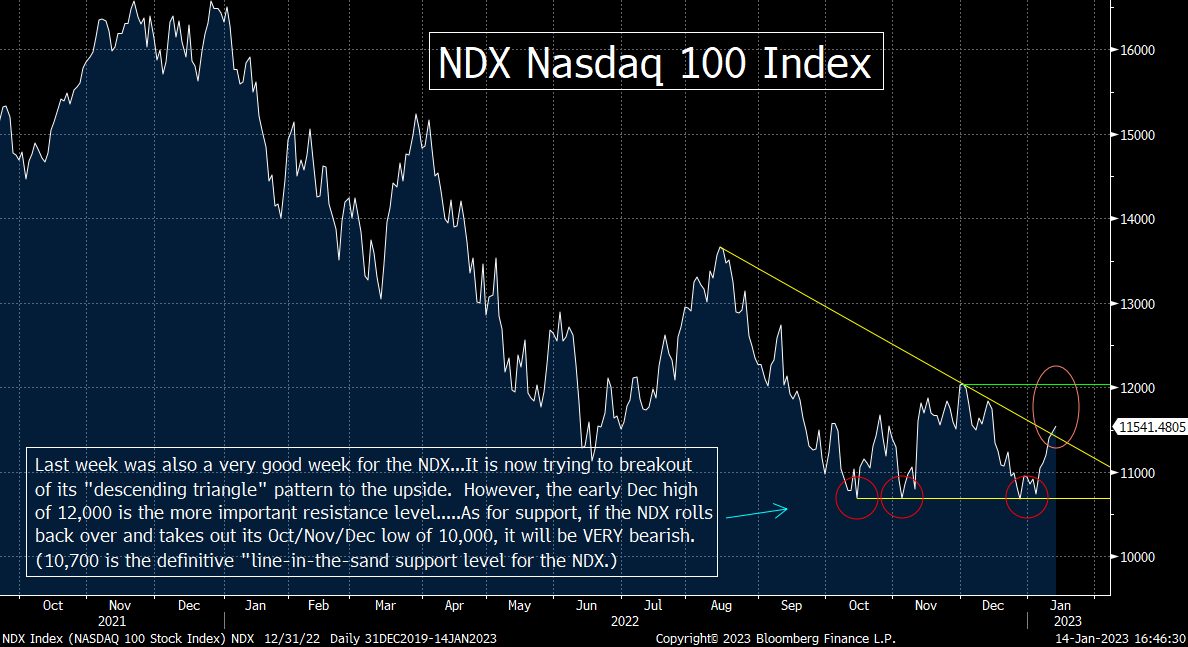
5) It’s halftime, so let’s update the charts on the S&P 500, the NDX 100 and the IWM Russell 2000. The S&P broke out of its sideways range…and is now quickly testing its next (more important) resistance level…..The NDX is trying to play catch up (and it has given us a definive “line in the sand” support level to watch going forward…..Finally, the IWM has broken above its 200-DMA, and if it can see a meaningful break above 1,900, it will be very bullish!
The S&P 500 index broke meaningfully above the sideways range early last week…and quickly rallied to its next (more important) resistance level. That level is 4,000…and its more than just a round number. Of course, a big round number is always important psychologically, so if the S&P can indeed break above that level in a substantial manner, it WILL be a positive development. However, the fact that the 4,000 level is also where the 200-DMA comes-in…AND where the trend-line from the all-time record highs come-in…it’s even more important. The 200-DMA has provided very tough resistance in the last year…and multi-month trend-lines are ALWAYS important. Thus, the S&P is standing at very important juncture.
Obviously, if it can break above its current level in a significant way, it’s going to be very bullish. If, however, it rolls-over from its 200-DMA and its 12-month trend-line, it’s going to be quite bearish…given that every failure of the past year has been followed by a material decline in the stock market.
Having said all that, this situation might not get resolved immediately. We could bounce around and “cling” to the 4,000 level for a little while…maybe even a week or two. Therefore, we’re not trying to say that the first day or two of next week is going to tell us which way this situation is going to playout. However, whenever we DO get a significant move above or below 4,000, it should be an extremely important development on the technical side of things as we move through the rest of January.
The NDX had an excellent week last week as well. It’s 4.5% rally took it slightly above the top line of its “descending triangle” pattern, so that is a positive development. Of course, we always want to see a meaningful break above or below any resistance or support level, so we’ll want to see more upside follow-through before we get too excited about the move. Besides, the more important resistance level for the NDX is the early December high of 12,000. A material break above that level would take it above its trend-line from the end of 2021…and give it a key “higher-high.” That would be very bullish for this tech laden index.
We do need to point out, however, that if the NDX rolls-over in a substantial manner at any point in the coming weeks or months, the 10,700 level will be the CRITICALLY important support level to watch. That was the low from October, November AND December. Therefore, any significant break below that level will be extremely bearish for the NDX…and for the entire stock market. It will tell us that another big leg in the current bear market is upon us…and that we have a lot lower to go before it bottoms.
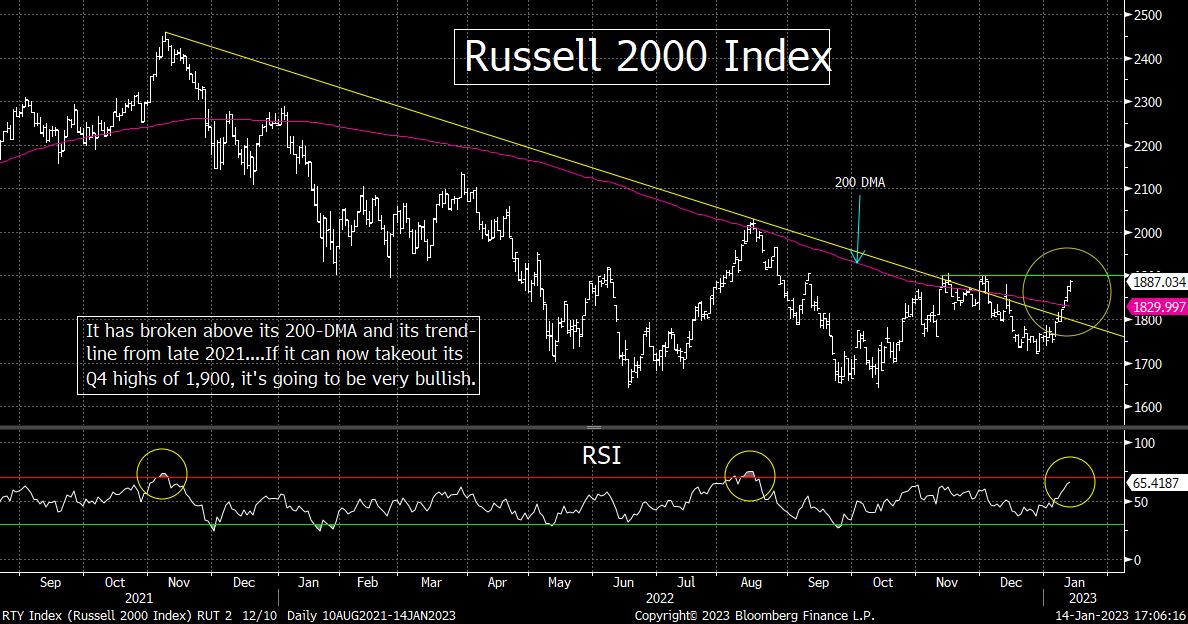
Probably the best chart in the stock market today is the Russell 2000. It has already broken above its 200-DMA…AND meaningfully above its trend-line from the Q4 highs of 2021. It is now close to testing its Q4 highs of this 2022 (in November and early December), so if it can break above that level in any meaningful way…after already breaking above 14-month trend-line (and its 200-DMA)…it’s going to be very bullish for this small-cap index.
That kind of breakout…if (repeat, IF) it happens…could/should be something that gives the bulls a very positive argument. If the small-cap stocks can breakout in a big way…and sustain that rally…it’s going to raise the odds of a soft landing considerably. As you know, we don’t see a soft landing on the horizon, but if the domestically driven Russell 2000 can continue to rally in a powerful way, we’ll have to reassess our thinking about a hard landing.
The Russell is approaching overbought territory. It’s not quite there yet…but it’s close. Therefore, it might have a very tough time breaking that its next key resistance level. This could be especially true if we start to see earnings guidance start to come down as we go through earnings season. If the group does indeed rollover soon, it would certainly be quite disappointing for the market. In other words, like the S&P 500, the Russell 2000 stands at a critical juncture on the technical side of things…and thus the next few weeks are going to be very important for the entire U.S. stock market.
We have to admit that all of these indices are very close to levels which, if broken to the upside, will put a dent in our bearish outlook. However, it will not cause us to change our outlook…but it will certainly causes us to look at the markets a bit differently over the next few weeks. In other words, if the short-term situation changes, we’ll change our stance somewhat. However, it’s going to take a BIG change in the facts to make us move into the bullish camp.
6) As good as the stock market acted last week, there were some developments that reminded us of the bear market rally we experienced this past summer. As they did during the summer rally in stocks, cryptos like Bitcoin rallied strongly…as did some meme stocks like Bed Bath & Beyond (BBBY). The return of such outsized moves in these assets shows that there is still a lot of froth in the marketplace…and it also shows that investors continue to “act” in a much less bearish way than they “speak.”
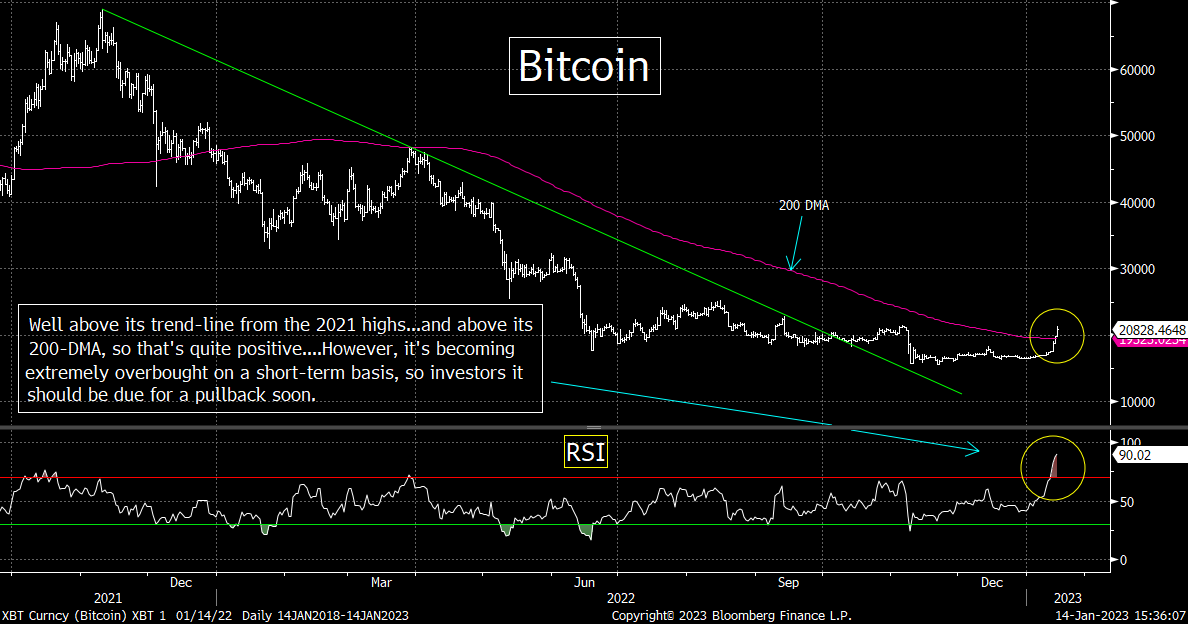
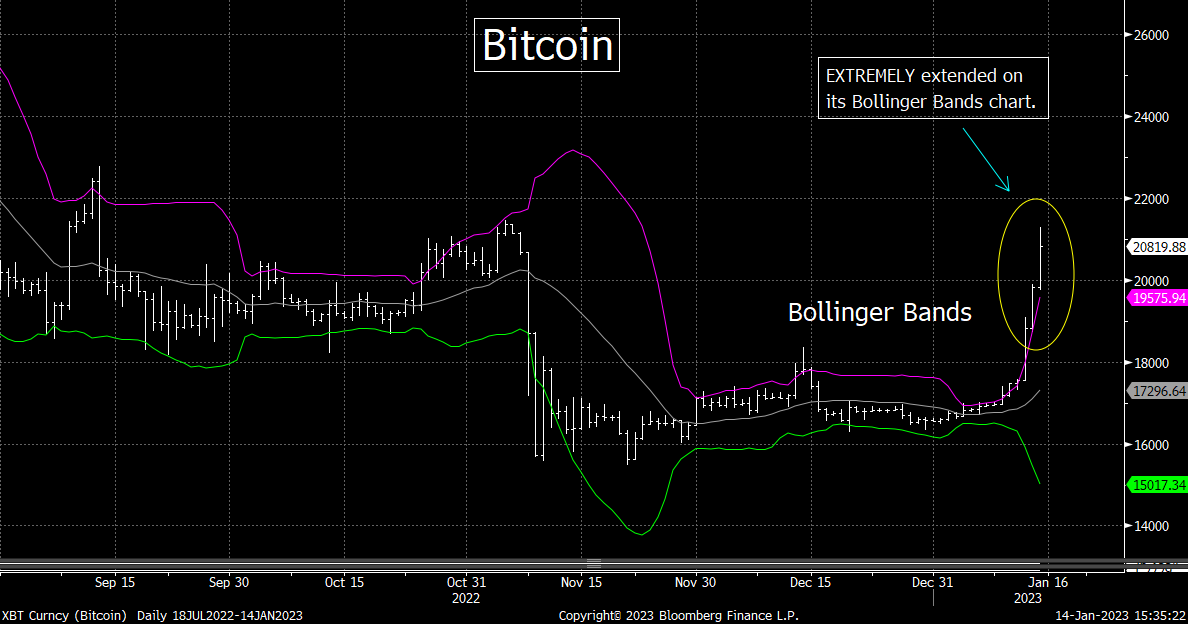
The huge (25%) rally in Bitcoin since the beginning of the year has been fantastic for the crypto bulls. Most of this rally has come in the last week (since the close of trading on Friday, January 6), so there have been some concerns about how long this rally can last. (Even the biggest bulls must be worried that this is coming too far, too fast.)
There are stories around the Street about a massive short squeeze…and once that runs its course, these cryptos will roll back over in a material way. Of course, the bulls say otherwise. They are saying that supply issues are helping this asset class…while other say the rally is due to optimism surrounding inflation is causing the rally. (Weren’t these the same people who said cryptos were a good hedge against inflation?) Anyway, when something rallies 22% in just a week, it’s a good bet “short covering” has played at least some sort of role.
We also saw a big bounce in Bed, Bath and Beyond (BBBY) last week. At its best level, the stock was up over 350% on the week! When you combine this with the huge rally in Bitcoin, it is very reminiscent of what we saw during the bear market rally in stocks over the summer. Back then, Bitcoin rallied 28% and BBBY jumped 400%...just before the market rolled over and fell to new lows over the next few months. In other words, when the cryptos and the meme stocks engaged in big bounces during the summer stock market rally, it was not a bullish development. Rather, it showed that the enthusiasm and froth that existed in the marketplace in 2021 had not been wrung out of the markets yet. We worry that it’s telling us the same thing this time around.
That said, we do need to point out that Bitcoin has broken well above its trend-line from its all-time highs in November 2021. It has also broken above its 200-DMA…and is now close to making its first “higher-high” since God was a child. If it can close above its November closing high of $21,355 in a significant way, it’s going to be very bullish for the crypto on a technical basis.
Having said this, we also need to point out that Bitcoin has become extremely overbought. It RSI chart has pushed above 90 this weekend. That’s a reading we haven’t seen in over two years. Yes, we DO know that Bitcoin is an asset that has become even more extremely overbought at times over the years…so it could still rally further over the very-short-term. However, given this reading…and the fact that the Bollinger Bands chart shows that it’s getting more than 2-standard deviations above its 20-DMA…the odds are high that Bitcoin will see some sort of meaningful pullback soon.
Therefore, even if you think Bitcoin is going to race back up to $30k before too long, you might want to avoid chasing it at these levels. You should get a better entry level at some point in the coming days/weeks.
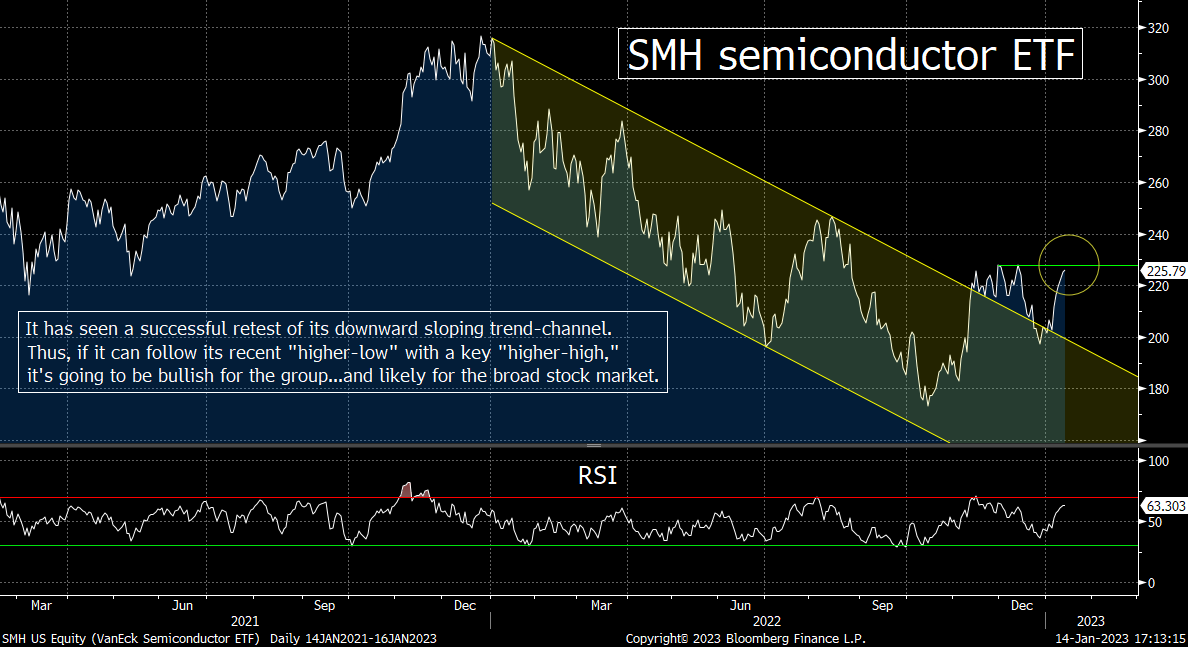
7) Despite some disappointing numbers out of Taiwan Semiconductor (especially their 10% cut in capital spending), the chip stocks has a good week last week. The SMH semiconductor ETF rallied 6.7%...and this took it close to a very important resistance level. If it can break meaningfully above that level in the coming days/weeks, it’s going to be bullish for the group…and since it’s a key leadership group, that kind of move would be positive for the broad market as well.
Even though some of the analysis of Taiwan Semiconductor’s (TSM) earnings report last week was positive, we think most of that derived from the reaction in the stock…rather than the announcement itself. (How can they speak negatively about the release if the stock goes up?) However, much of their guidance was quite cautious…and the fact they the announced a 10% cut in capital spending was a big yellow flag in our minds.
HOWEVER, the stock did rally last week…and it helped the SMH semiconductor ETF rally along with it. In fact, the group has acted quite well lately. After going back and retesting the top line of its downward sloping trend-channel, it bounced off that line quite nicely. It is now moving close to testing it’s Q4 2022 highs. If it can follow the recent bounce off the trend-channel…with a meaningful “higher-high,” it’s going to be very bullish for the chip stocks. That kind of move will signal a change in trend for this all-important leadership group. If (repeat, IF) that happens, it’s going to change our thinking about the timing of the next leg to the current bear market.
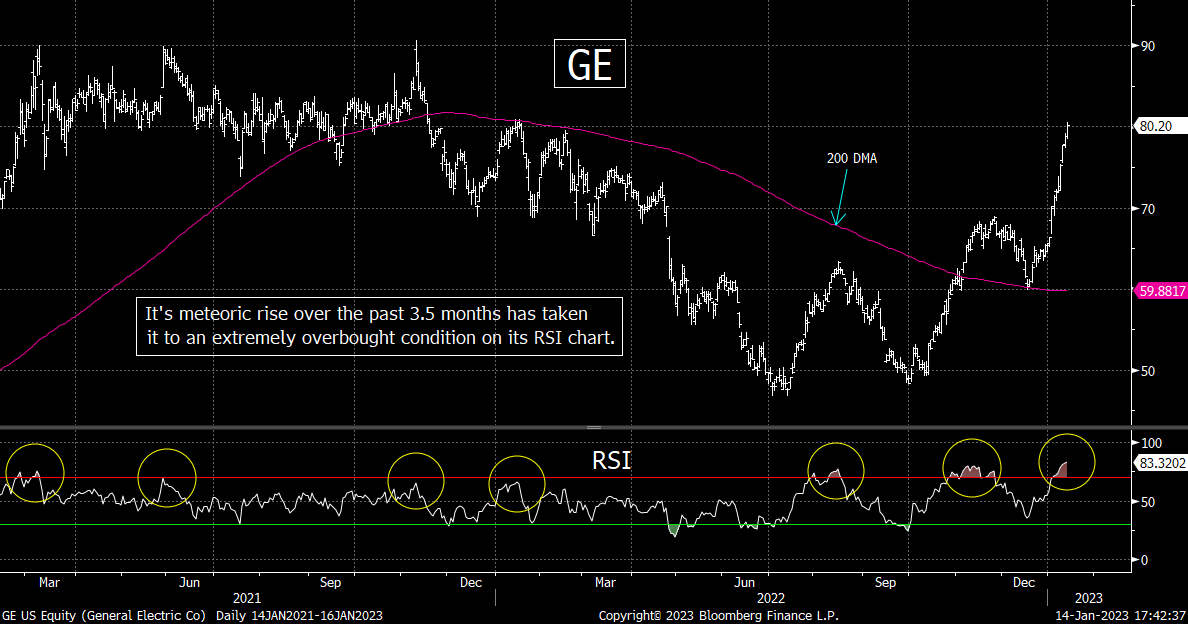
8) There are a lot of things going on in the marketplace…and a lot of things going on at GE (with the company splitting into 3 parts). However, there is no question that the stock has become incredibly overbought on both a short-term and an intermediate-term basis. Therefore, investors should be careful about chasing this stock after its meteoric 66% rise since the end of Q3 2022.
There have been all sorts of stories swirling around the markets about what is driving this year’s early-January rally. Repositioning by CTA’s…new money inflows…big liquidity injections from the BOJ…etc., etc. Some of them are likely very true…especially the one about money inflows…which we get every year. In fact, maybe they’re all true. Heck, maybe the real reason for this rally is because inflation IS going to come down dramatically and the economy IS going to avoid a recession (even though that argument is contradictory).
However, no matter what is really going on in the stock market, it’s hard to figure out what is going on with GE’s stock. While nobody was looking, GE has rallied 66% since the end of Q3 last year! (Just think where the DJIA would be if GE was still in it!) The company is splitting up into 3 parts, so maybe investors believe that a lot of fabulous value is going to be unlocked when the split up takes place…even if that’s not going to happen until 2024.
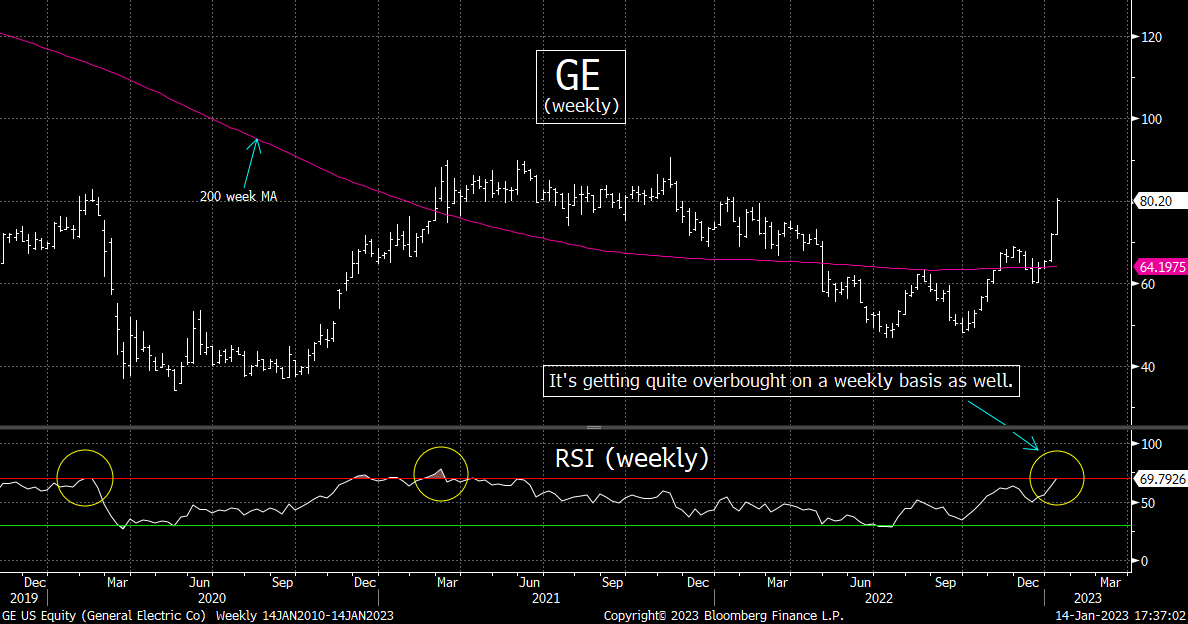
Either way, after the meteoric rally of the past 3.5 months, the stock has become extremely overbought. The reading on its RSI chart has reached the mid-80s…which is a level that has been followed by pullbacks in the past. Similarly, its weekly RSI chart is getting quite overbought…and its weekly Bollinger Bands chart is getting quite extended as well.
We do not cover the stock, so there might be some very good reasons why the stock is rallying so strongly that we’re not aware of…and/or its prospects might be absolutely fabulous. However, no stock moves in a straight line…so we believe that investors should avoid chasing GE at these levels. It is getting quite ripe for at least some sort of short-term pullback…if not something more.
9) We hate to beat a dead horse, but we want to reiterate (once again) our belief that too many investors are making the mistake of thinking that we are going to return to the type of markets we experienced over the past 14 years once the Fed stops raising interest rates (i.e., once they “pause”). Instead of returning to the steroids era of the past dozen years or so, we believe that the Fed is going to let the markets trade on their own. We also believe that that the markets have not priced-in this new reality.
Ever since the bottom was put-in for the markets at the end of the Great Financial Crisis, investors have enjoyed abnormally low interest rates (rates that have been lower than their natural level…lower than where they would have been if they were trading in-line with the economic growth at the time…and lower than they would trade on their own). Investors have also enjoyed the impact of significant liquidity injections into the financial system (sometimes, they were massive injections). This has come to an end.
During this era of uber-low interest rates and extremely high artificial liquidity, investors became used to artificially high valuation levels for the stock market. They came to believe that these valuation levels were the normal levels. However, since ultra-low interest rates and QE are over, those artificially high valuation levels can no longer exist.
No, we are not saying that the Fed will not cut interest rates again in the future. Heck, they might cut them this year. However, we ARE saying that they’re not going to cut them to a level that is well below their natural level again…and they’re not going to provide massive QE programs. Sure, if the economy weakens in a meaningful way, the Fed will indeed cut rates…but they’re not going to slash them anywhere near to the degree they did in 2020/2021. Therefore, it is our belief that we are in the middle of a process of valuation compression…and thus the stock market will have to fall further…EVEN if we do not have a recession. If we do have a recession…which we believe is very likely…the decline will have to be a larger one.
It is our belief that many investors are missing what the Fed is really telling us when the say (ad nauseam) that they’re going to keep rates “higher for longer.” We believe that they’re really telling us that they are not going to be as aggressive as they have been over the past 14 years when they DO have to eventually pivot.
They’re telling us that the era of free money is over and so is the era of massive liquidity injections. Therefore, the era of multiple expansion is over as well……Let’s face it, saying that the stock market is rallying due to “multiple expansion” is not giving a legitimate fundamental REASON for a rally. It’s merely saying that the stock market is getting more expensive. Without the steroids, we are now facing an era of multiple compression…or as we like to call it, “multiple normalization.” That’s bearish for a stock market that is trading at almost 18x earnings and 2.3x sales.
10) Summary of our current stance………The stock market rallied over the first five trading days of the year. Trivia buffs will tell us that the stock market ends the year higher 70% of the time when that happens. That’s great, but in certain bear market years…like 2002, 2018 and 2020…a rally over the first 5 trading days did not prevent the S&P from dropping 33%, 19% and 35% respectively from its highest level to its lowest level of that year. Then again, the odds are rising considerably that the full month of January will finish in positive territory, so maybe THAT will be the signal we need to declare this bear market is over. (Heck, even if earnings crash, or if China invades Taiwan, you won’t have to worry about the impact it will have on the stock market…as long as January is a positive month!)
Anyway, there is no question that the stock market acts very well. The breadth has been good…and the S&P 500 equal weight index has outperformed the regular S&P 500 index over these first nine trading days of the year. The tech stocks are finally catching a bid…and 10 out of the 11 S&P groups are up YTD. (Only the healthcare index is slightly lower so far this year…despite the recent bounce in the biotech group.)…..On top of this, we are seeing inflation come down and the Fed indicate that they’re not going to raise interest rates for much longer. Also, China is relaxing its covid restrictions and they seem to be loosening their grip on some of their industries as well…..Finally, all three of our most recent Presidential candidates (Clinton, Trump and Biden) have taken top secret/restricted materials to their homes…and the House elected a new Speaker in an historic manner. (Oops, those last two examples should not be on the bullish side of the ledger…Sorry.)
However, this very much reminds us of what we saw over the summer. Even though the market remained expensive and over-leveraged back then, a bull market rally took the stock market higher…and allowed some assets from the frothy period of 2021 to bounce in a big way. In other words, not a lot had changed in the big picture of things…and we believe that this is still the case.
It all goes back to our central theme: The stock market cannot stay at valuation levels we’re seeing at the present time without artificially low interest rates…and some sort of liquidity-injection program (like QE). Therefore, even though it will be very healthy for the stock market over the long-term if (repeat, IF) interest rates and inflation keep falling to the degree they have in recent months, it won’t be enough to keep the stock market from falling further. It won’t keep it from falling until it reaches a level where it can trade on its own…without artificial stimulus. And since lower stock prices will lead to more de-leveraging…it means that the stock market will almost certainly fall BELOW fair value before it bottoms…just like it has in every bear market since (at least) WWII.
It's all interrelated! The stock market was pushed FAR beyond its underlying fundamentals in 2020/21 to save the system from the impact of the pandemic. Interest rates were pushed well below their natural level as well. Long-term interest rates CAN come down, BUT if they only fall to their natural level. They’re not going to fall to zero again…and they’re going to fall because of economic weakness, not because the Fed is buying those bonds hand over fist! Therefore, the markets will not have the kind of excess liquidity that existed for much of the past 12-14 years. This means that stock prices will have to continue their process of moving back to THEIR OWN natural level. That “natural level” won’t be found at 17-18x earnings or 2.3x sales.
11) I will be presenting at the MoneyShow Virtual Expo that runs this week on Tuesday and Wednesday, January 17-19. I will be presenting on Tuesday at 2:00 EST.
The MoneyShow Virtual Expo
For detail on how to sign up for this great event, see the link below. https://online.moneyshow.com/2023/january/virtual-expo/speakers/8c79900647b24f94b9ef99bac1911430/matthew-maley/?scode=058843
Matthew J. Maley
Founder, The Maley Report
TheMaleyReport.com
matthewjmaley@gmail.com
Although the information contained in this report (not including disclosures contained herein) has been obtained from sources we believe to be reliable, the accuracy and completeness of such information and the opinions expressed herein cannot be guaranteed. This report is for informational purposes only and under no circumstances is it to be construed as an offer to sell, or a solicitation to buy, any security. Any recommendation contained in this report may not be appropriate for all investors. Trading options is not suitable for all investors and may involve risk of loss. Additional information is available upon request.