
The "Fed put" Is Back...But For How Long?
We have some new readers, so we want to reiterate that we always try to provide points from both sides of the bull/bear ledger each weekend. Therefore, it might seem like we’re sending out conflicting signals from time to time. However, we do try to let people know which side of that ledger we stand on at any given time, so there shouldn’t be any problems figuring out our overall opinion.
Table of Contents:
1) The rally off the March lows in stocks has been liquidity driven…pure and simple.
2) The debt ceiling debate has actually been a non-factor in the marketplace so far.
3) The S&P 500 & NDX 100 are at very important resistance levels, but they’re also overbought.
4) Last week gave us more evidence that we’re heading for a recession.
5) Tech acts great, but the XLK and SMH tech ETFs are also getting overbought.
6) We’re less bullish on the energy sector, but we’re not bearish…at least not yet.
7) Defensive groups: Normal pullback or the beginning of a rotation away from these groups?
8) Japan’s stock market has become ripe for a short-term pullback.
9) AI is going to cost A LOT of people their jobs.
10) Summary of our current stance: The “Fed put” is back…but for how long?
1) The strong performance in the stock market since the March lows has had A LOT more to do with the liquidity injections that have been performed to prevent panic during today’s regional banking crisis than it does with the economic outlook, the Fed outlook or even AI. If/when the liquidity fades, so will the markets.
The action in the marketplace over the past few months is somewhat reminiscent of what we saw in the second half of the year in 2019. As we moved towards the month of August of that year, the stock market was quite expensive…at 18.5x forward earnings and 2.2x sales. However, the S&P had seen a nice rally off the early June lows that year, so the stock market still seemed in good shape. Then, as we moved through August, things started to change quite quickly. Almost overnight, it became evident that the repo market was having problems. This caused the S&P to fall about 7% very quickly. Things in the stock market stabilized at that point, but the repo market remained in turmoil.
Then, as we moved into late-September/early-October, things came to a head. The repo market was in disarray and the Fed moved in and started pumping liquidity into the marketplace to stabilize the situation. (They said it was not a QE program…so we referred to it as the “not QE, QE program.”) As the liquidity was pumped into the system, the stock market caught a bid…and didn’t look back. It rallied 11% from early October until the end of the year. In fact, even after the Fed turned off the “not QE” program at the end of the year, the residual effects (and the momentum that came with it) took the market higher into February…and the rally became a 16% one off the October lows before it topped out. (A little thing called Covid-19 changed the situation just a little bit.)
This year has been somewhat similar. Of course, there are a lot of differences as well, but a nice rally in the stock market to start the year had taken the S&P up to level where its P/E ratio was 18.5x earnings and 2.3x sales…just like it did in the late summer of 2019. Then, in March, the marketplace faced a new serious problem. Instead of problems in the repo market, it was a mini-crisis in the regional banking system this time around. Like it did in 2020, the stock market flinched in a meaningful way…dropping 7% over a very short-time frame. However, just like 2019, an influx of liquidity was able to help the stock market bounce back in the face of this year’s crisis.
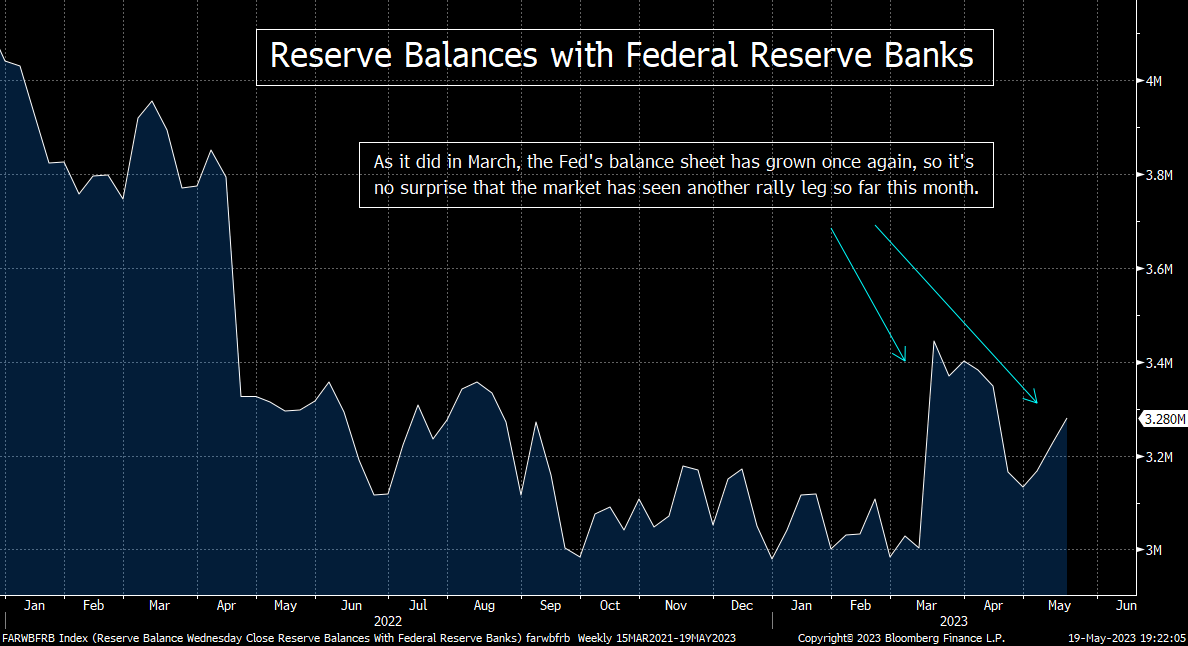
If you look at the chart below on the “Reserve Balances with Federal Reserve Banks,” you can see how this has played out over the past 18 months. During 2022, the reserve balances shrunk considerably (after blowing through the roof from March 2020 until the end of 2021 to help save the financial system from impact of the pandemic…not shown on the chart.) This, plus the increase in interest rates, caused the stock market to get clobbered for much of last year. The market then was able to bounce from a very oversold condition from October until early February…and it’s no coincidence that the reserve balances stabilized at that time.
However, the reserves began to drop again in February and March…and sure enough, we got some more weakness in the stock market. However, the situation changed in a big way. Silicon Valley Bank began to teeter…and it quickly failed…which was followed by a few other banks. As you can see from the chart, as that took place, the reserve balances jumped in a major way. THEREFORE, instead of falling out of bed when the regional banking crisis hit another (higher) gear, the stock market actually RALLIED strongly. (To be honest, you don’t really need to look at that chart to know some outside force helped the markets. Stocks don’t rally on their own during banking crises…even minor ones.)…….Anyway, we can also see from the chart, the reserve balances have jumped again in May (even though the Fed’s total balance sheet has shrunk), so it is no surprise that the stock market has seen another rally leg over the past two weeks.
Of course, liquidity injections are not the only reason why the stock market has rallied since March. There has been some serious short covering…and we’ve also seen some good news along the way. However, as we will discuss in other points this weekend, the overall fundamental picture has deteriorated since March, not improved. Thus, the change in the liquidity injections have indeed played the most important role in our opinion.
Needless to say, the hoopla surrounding artificial intelligence (AI) is getting a lot of the credit. We do agree that AI will be a world-changing phenomenon…and thus it has certainly had a positive impact on the tech sector and the markets. However, we still believe that the added liquidity has made it a MUCH bigger deal to these stocks than it would have if there had not been these significant injections. We need to remember that THIS IS EXACTLY WHAT TOOK PLACE IN THE LATE 1990s!!! Back then, substantial levels of liquidity were injected into the system so that the Y2K issue would not cause a panic and a melt-down. It was these injections that really provided much of the fuel to help so many internet (and other tech) stocks move higher is such a forceful way back then, NOT the “new economy.” The same is true today with the AI stocks.
Again, we’re not saying that the AI stocks would not have done well this year…just like we are not saying that the internet stocks would not have done well at all in the second half of the 1990s. What we are saying, however, is that neither the internet stocks of yore…nore the AI stocks of today…would have done anywhere near as well as the did/have if it were not for excess liquidity. More importantly for investors today, when the liquidity fades, the expensive AI stocks will fade with it…just like the internet stocks did from 2000-2003…and the broad stock market will fall along with them.
2) We’d like to talk about the issue of the debt ceiling debate in a very different way than most of Wall Street is talking about it. The main reason we want to do this is because we strongly believe it has had a much smaller impact on the markets than some on Wall Street have portrayed. In other words, this is a meaningless issue…UNLESS it becomes an important one. However, the only way it can become an important one is if DC completely screws up, but we won’t know about that for another week or more…..However, we do need to point out that some people ARE betting that the situation will blow up.
The debt ceiling issue received WAY too much attention last week. To a certain degree, this is not a big surprise…because the amount of economic data and earnings releases was very low last week vs. previous weeks. Thus, people needed something to talk about…and the situation in Washington DC fit the bill very nicely.
There certainly wasn’t any breathtaking positive news that came out last week. Sure, there has been some speculation this week that two sides were getting closer to a debt ceiling deal a few times. However, since the stock market had not gone down over the fear that anything like that will happen, we question how much of a positive impact that had on the nice gains we saw mid-week last week.
Think about it. Is a resolution to the debt ceiling debate going to change what the Fed does with monetary policy going forward? Will coming to an agreement on this issue have an impact on much banks pull-in their horns when it comes to lending for the rest of this year? Is the consumer going to spend more once they resolve the debt ceiling dispute? The answer to these questions is a resounding NO.
In fact, the only impact this issue will have on the economy is if the talks collapse and the U.S. defaults on their debt. Put another way, the only outsized effect it can have on the economy is a negative one! Thankfully, the odds of an actual default are extremely low, so we understand why the markets are not anticipating a negative outcome. However, as we discussed in point #1, we do not think it had much of an impact on last week’s advance in the stock market…..(Don’t get us wrong, whenever there was a positive or negative headline on the news-tape about the debt ceiling issue, the algos did move the market in one direction or the other for a short while. However, there is rarely any follow-through movement to those kinds of headlines.)
Again, we do agree with the consensus…which says they’ll wait until the 11th hour…and then agree to something after each side has done their job of appearing to fight hard for their side’s case. Therefore, we also agree that the odds are very low that a default will occur. HOWEVER, some people ARE betting that the U.S. will default…or at least they’re spending a decent amount of money to hedge against that possibility…which is something we are seeing in the credit default swaps (CDS’s).
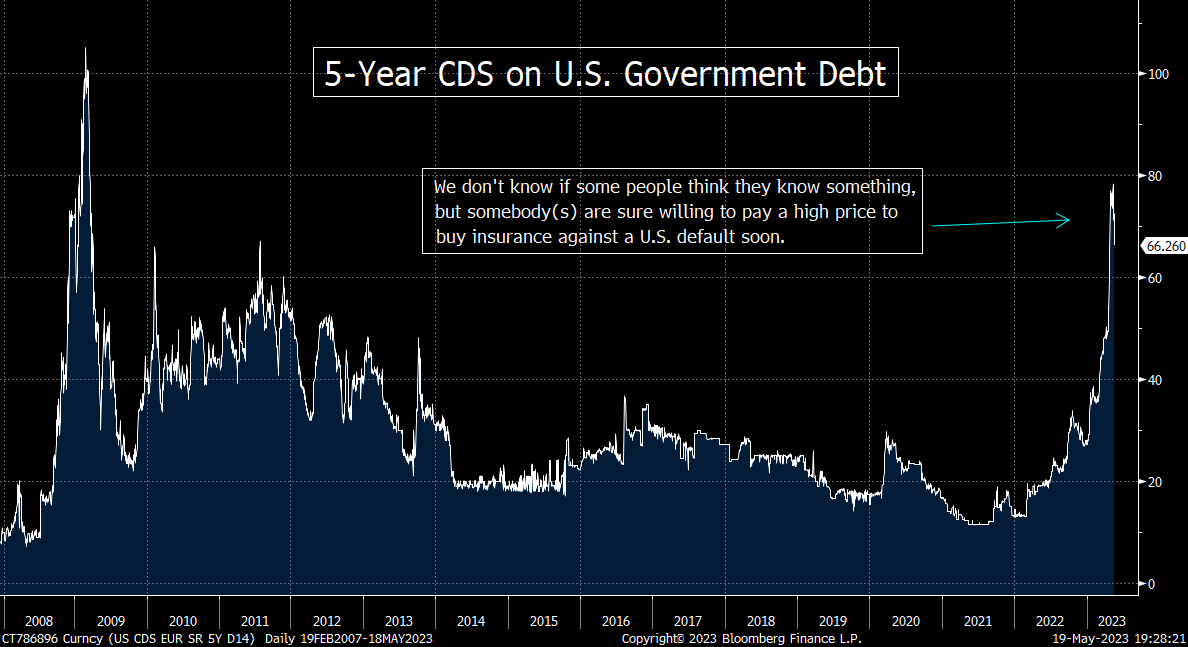
If you look at the CDS prices for U.S. sovereign debt, they have risen dramatically since early April. (See chart below.) Of course, this move in the price to insure against a U.S. default has been widely disseminated around Wall Street, but it is not something that has been sited as a reason to be concerned in a big way. In other words, even though a lot of people have mentioned this move in CDS prices, most people have not cited it as something we need to worry about. (Again, the reason for this…is the assumption that we’ll never default just because of a debt ceiling vote. We might default someday, but it won’t over a silly vote…or at least that’s what common sense tells us.)
However, somebody IS spending real money to buy this protection. (Again, CDS prices are a measure of the cost of insuring against default.) Yes, these prices did come down somewhat this past week, but they did rise above their 2011 highs…which was the last time this issue came to a head. No, the cost of insuring against a default did not surpass the early 2009 highs, but we want to reiterate that some people ARE paying very high prices for this protection……It’s just something that makes us go hmmmm.
What we’re really trying to do in this bullet point is to say that if Washington does avoid a default, it will NOT be a reason for the stock market to rally for more than one day…two at the most! Relief on this issue is not going to make the fundamental outlook any better…because the fundamental outlook has not been diminished by this issue!!!.......However, if for some reason, our politicians screw up the whole thing, the result of a default will be a disaster…and that there are some people who are spending real money to protect against that outcome. (So, in the back of our minds, we keep asking ourselves, do they know something we don’t know?)
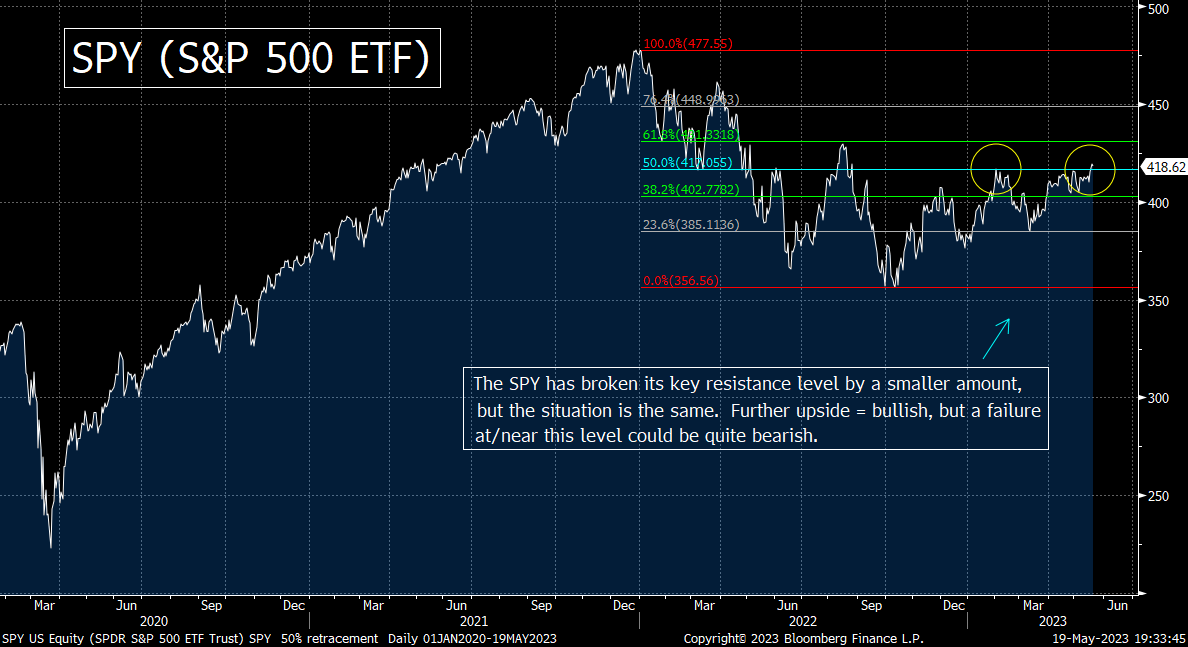
3) The S&P 500 and the NDX Nasdaq 100 both are testing CRITICAL resistance levels right now, so we want to touch on their charts early in this weekend’s edition….The S&P is testing it March highs and the 50% retracement level of the entire bear market…and the NDX is testing its August 2022 highs and the 50% retracement level. Therefore, whether they break above those levels in a meaningful way…or “fail” at those levels...should be very important for the stock market going forward.
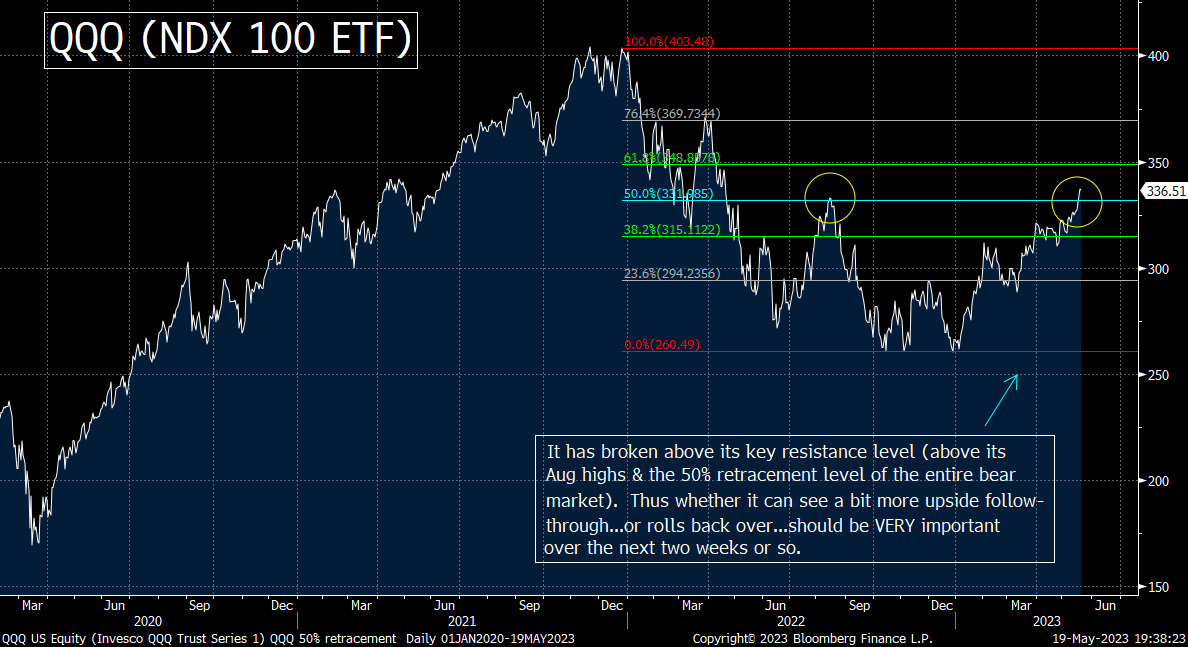
In our opinion, the stock market is testing some incredibly important resistance levels right now on the technical side of things. In fact, the NDX Nasdaq 100 index has already broken above its key resistance level. However, it needs to see some more upside follow-through to confirm the breakout. (The reason for this is two-fold. First, we always want to make sure that a “breakout” is not a “head fake.” So, we want to see it break above its key resistance level by at least 2%-3%...and for it to hold above that level for more than just a few days. Second, the break above its key resistance level for the NDX took place on an expiration, so this raises questions about whether the late-week “break” was an artificial one…that will be reversed quickly.)
Let’s be more specific about this situation on the NDX. (We’re also going to highlight the levels for the QQQ…which is the ETF for the NDX…and is what most people trade when it comes to this index.) For the NDX, the 13,650ish level was the high for the NDX back in August. (That level for the QQQ…NDX ETF…is 333.) Therefore, if the NDX & QQQ can rally further from here…and break above those August highs in a more significant way, it’s going to give it a KEY “higher-high.” However, this level is also the 50% retracement level of the entire bear market…so it is even more important than just a “higher-high.”
As we have highlighted in the past, bear markets very rarely roll back over and continue in a meaningful way once a bounce has retraced more than 50% of its decline in a significant manner. Put another way, once a rally has retraced more than 50% of its bear market decline in any material way, it usually signals that the bear market is over. Therefore, if the NDX rallies much further in the coming days (without any meaningful decline in between), it’s going to throw some cold water on our cautious stance…at least for the remainder of Q2.
As for the S&P 500, it is bumping right up against its own all-important resistance level this weekend. A break above the 4,200 level would give the SPX a key “higher-high”…AND take it above its own 50% retracement level of the bear market. (We do need to point out that a “higher-high” for the SPX would involve a break above its March highs, not its highs from last August…like it will for the NDX. Thus, it won’t be quite as bullish for the SPX as it will be for the NDX, but it will still be very bullish. Like we said, any significant break above the 50% retracement level is a sign that a bear market is over.)
Having said all this, as always, the bulls have to be very careful about getting overly excited about this possibility. If the market rolls over in a substantial manner before too long, it will signal that these two indices have “failed” at their extremely important resistance levels. When any asset…whether it be an index, an individual stock, or an asset class…“fails” at a key resistance level and sees an important reversal, it is frequently followed by a substantial decline. (What happens is, the bulls take it as high as they possibly can…and when it fails to breakout above that key level, they walk away…and the market hits an air pocket.)
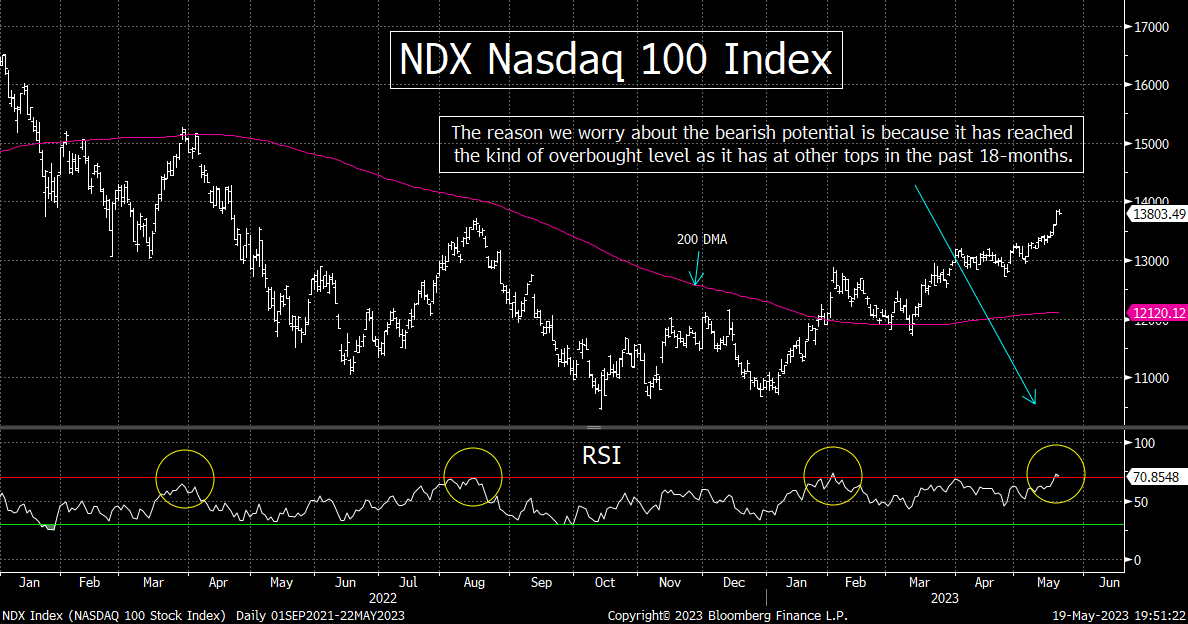
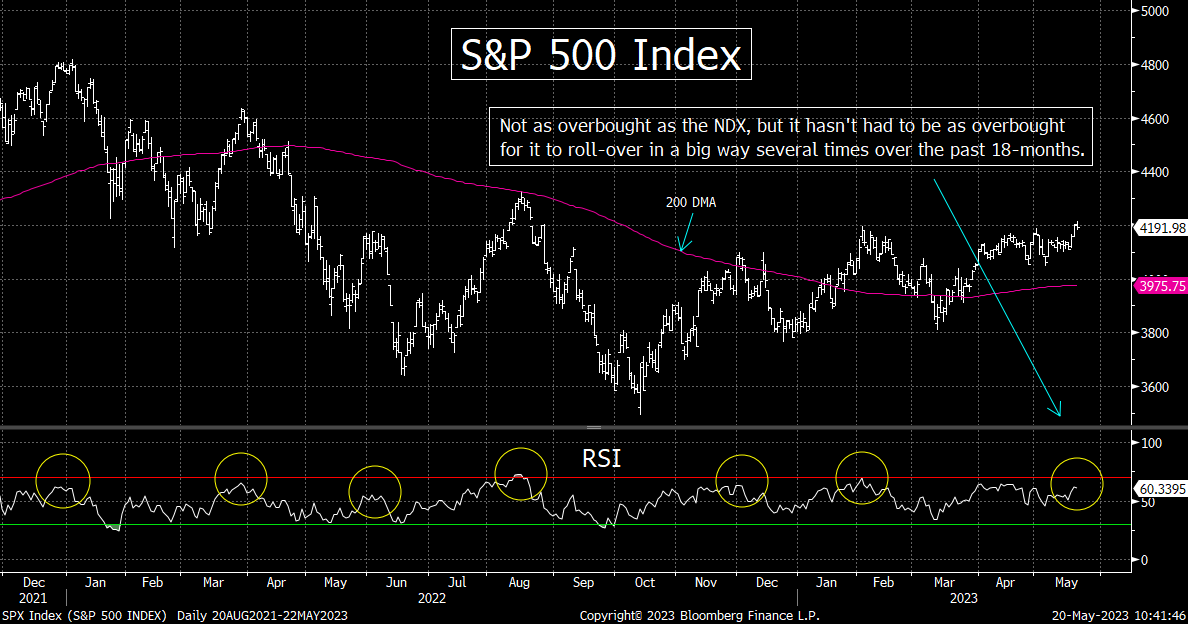
Making sure that we do indeed get a confirmed breakout move is ALWAYS incredibly important, but it’s even more important today…because these indices are getting overbought…AND the fundamental outlook is not a good one. If you look at the RSI chart on the NDX, you can see that it has reached the kind of overbought level that has been followed by significant declines over the past 18 months or so. Therefore, investors need to be very careful about assuming that last week’s mild beak above its key resistance for the NDX will indeed become a more meaningful one…..For the SPX, it’s not as overbought as the NDX, but it has not had to become as overbought at the NDX over the past year and a half for it roll-over in a substantial manner. Yes, it has become more overbought a few times, but it has topped at today’s level (and even at lower levels) on a few occasions.
As for the fundamental outlook, we’ll discuss that issue more in point #4, but we remain very worried about the economic outlook…and the data backs us up on this opinion…..More than anything else, we believe that the coming credit contraction will cause a recession in our opinion. Therefore, we believe that the odds are higher that the above-mentioned resistance levels we be a place where the stock market “fails”…rather than breaks-out……Either way, we still worry that the fundamental back-drop will be extremely difficult to overcome in the second half of the year…even if we get an upside breakout to end the second quarter of this year.
We’ll finish by adding that the resolution of this “critical juncture” for the stock market does not have to come next week. Even though the debt ceiling issue won’t be important at all unless an actual default takes place, investors are still focused on it in a big way, so the markets might bounce around up at these resistance levels for a week or two…….However, the action over the next 2-3 weeks should indeed be very important…given that the levels we have highlighted for the SPX and NDX are such key ones on the technical side of the equation. (Since investors trade the QQQ & SPY so heavily now-a-days, we have provided charts for both the SPX & NDX…AND the SPY and QQQ.)
4) We got some more indications that the economy is slowing last week. No, not all of data was lower-than-expected, but much of it was…and some of the poor numbers were construed as good numbers…simply because the stock market did not go down in reaction to that data. No matter what happens over the near-term in the stock market, the weaker economy will create serious headwinds for the markets eventually in our opinion.
Individual stocks…and the stock market…can move in a different direction than their underlying fundamentals for a period of time. We’ve all seen it. Sometimes a stock or a market can become overbought or oversold…and thus any new fundamental news can produce some strange reactions over the short-term. (In fact, sometimes, it can create the exact opposite reaction. Sometimes we get a “buy the news” move in reaction to bad news…and/or a “sell the news” reaction to good news.) As we discussed in point #1, the infusion or removal of liquidity is another item that can move a stock or a market in a different direction than any new-news would usually call for. Finally, when a stock becomes incredibly over or under-valued, they can move to such an extreme technical position that it doesn’t matter what the new-news might be. The stock/index will take a life of its own for a short time when that happens.
Last week, we saw a good example of what we just described. The stock market rallied despite the fact that we received some negative news on the economic front…and some comments from several retail companies which indicated that the consumer is starting to pull-in their horns.
We started the week on Monday with a much lower-than-expected number out of the Empire State Manufacturing data (which was -31.8 vs. -3.9 est). The retail sales data was also much weaker than expected…at 0.4% vs. 0.8% expected. Yes, some people tried to spin that number as a good one…because it was still a positive reading. However, if they are lower-than-expected, the expectations for overall growth going forward still has to come down…..Finally, we also saw the LEI (Leading Indicators) decline for the 13th month in a row!
On top of the much lower-than-expected retail sales number, we also got some cautious comments about the consumer from a number of different retail companies. Therefore, this shows that there are now some definite cracks in the wall of the consumer. We got comments about weakening consumer demand from Home Depot (HD), Target (TGT), TJX (TJX), & Foot Locker (FL). Even Walmart (WMT)…who beat expectations with their earnings…warned that they are “cautious on the health of the consumer.” (WMT tends to do better when the economy is having a rough time.)
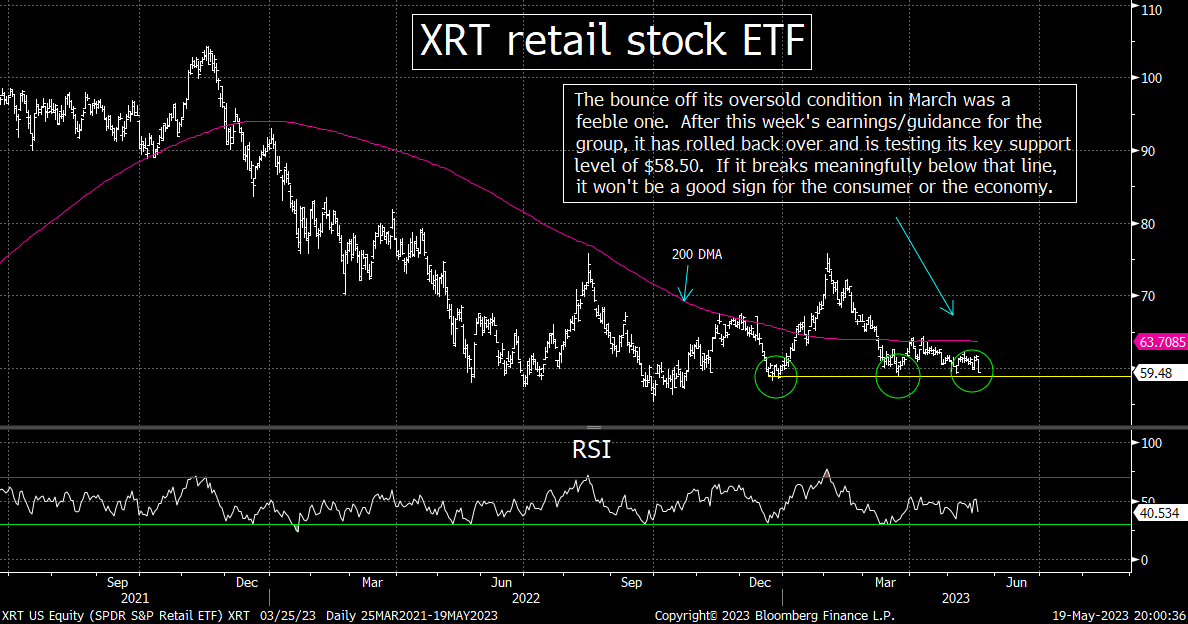
No, the consumer has not suddenly disappeared by any stretch of the imagination. Nonetheless, when you look at the U.S. personal savings rate at just 5.1% (well below the average of the past dozen years)…and combine it with the record high levels of credit card debt…and a regional banking crisis…it’s not hard to think that the consumer is not going to weaken more as we move through the summer months. Given that last week’s action took the XRT retail stock ETF back into negative territory for the year, the market seems to be telling us the same thing.
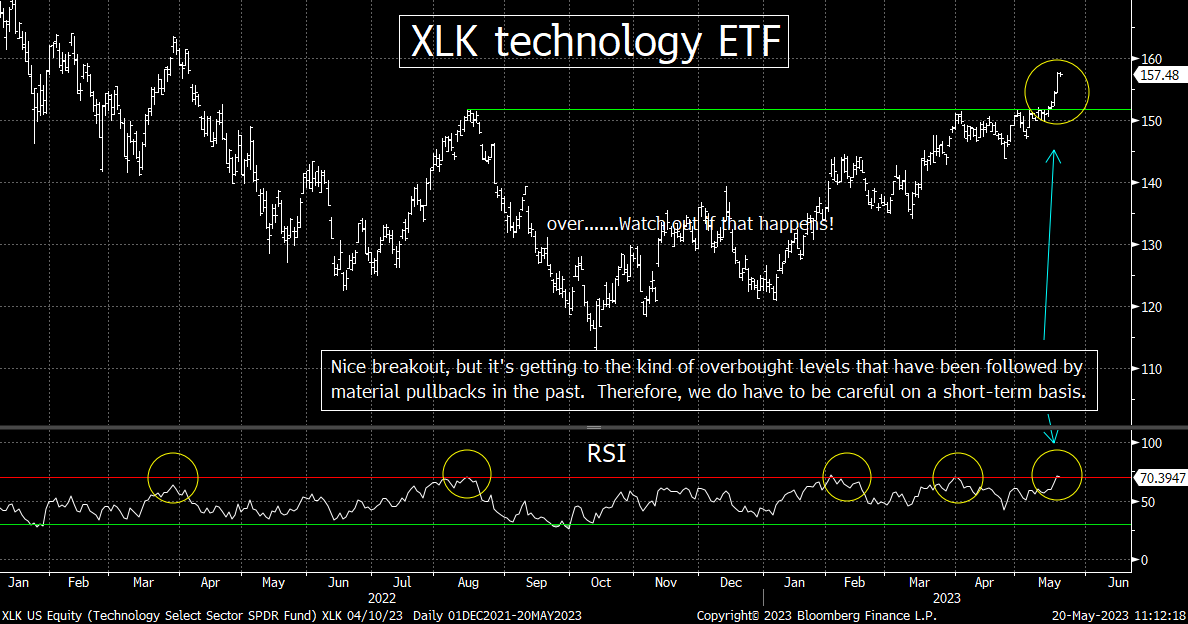
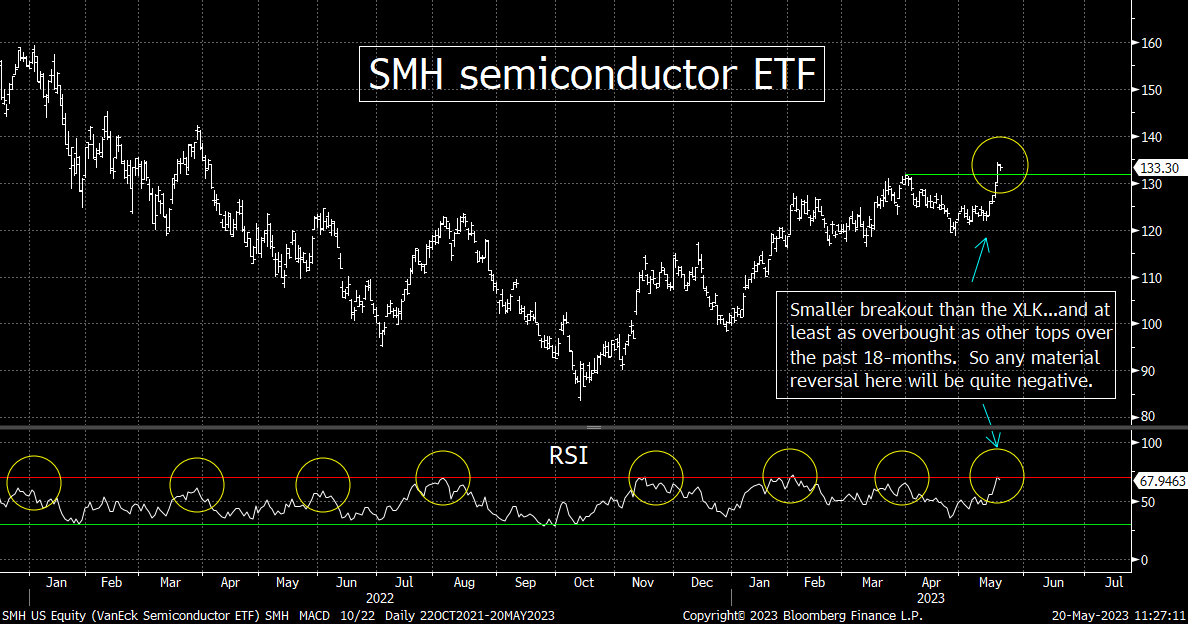
5) The most bullish action on the technical side of things last week came from the tech sector…which should not be a surprise to nobody. The XLK tech ETF broke above its key resistance level, so if it can see any upside follow-through, that will be quite bullish. The SMH semiconductor ETF also made a nice “higher-high,” but not by as much as the XLK…….HOWEVER, they are both now overbought, so the quality of the next pullback in this sector should be important for the group…and the broad market as well.
The XLK technology ETF had been bumping up against its August highs for two months…and it finally broke above that level late on Thursday. As we mentioned last weekend, the XLK had already broken well above its trend-line from the beginning of 2022, so the fact that it has also made a key “higher-high,” it’s definitely a bullish development. The only thing we have to worry about is that the RSI chart on the XLK has reached the kind of overbought level that has been followed by material declines since the beginning of 2022. In other words, if (repeat, IF) this overbought condition creates the kind of decline that it has for the past 17 months, last week’s breakout could turn into a great big “head fake” and cause some problems for the group that has been leading the stock market all year.
We have a very similar situation with the SMH semiconductor ETF. The chip stock ETF…which had already broken above its August highs…was able to break slightly above its April highs. This new “higher-high” was not as impressive as it was for the XLK, but if it can see some more upside follow-through, it will be quite bullish as well. However, like the XLK, the SMH has reached the kind of overbought condition that has been followed by meaningful declines over the past year and a half. Therefore, it is not out of the question that it could see the kind of reversal soon that will disappoint the people who have moved into this crowded group in recent weeks.
What we’ll be watching is the quality of the next decline for these two ETF. If they come on low volume…and they’re able to hold their “old resistance” levels…and bounce strong off those levels (or from just below them)…it’s going to be very bullish for the sector. If, however, they roll-over in a serious manner…on big volume…and take out their “new support” levels, it’s not going to be good at all given that many of leadership stocks in this sector have become quite expensive after their 2023 advances. (Remember, “old resistance becomes “new support.”)
6) During the week last week, we turned less constructive on the energy stocks over the intermediate-term (but we did say they could bounce short-term from their oversold level). This weekend, the cover story in Barron’s is a bullish one on crude oil, so we feel even better about our change. That said, it’s NOT a bearish call. We’re just think it’s going to be tougher for the sector to outperform to the degree it has over much of the past 2.5 years.
Back in the fall of 2020…when EVERYBODY was bearish on the energy stocks…we turned extremely bullish on the sector. The broad consensus opinion in the marketplace was that that fossil fuel companies were dinosaurs and had no future. We, however, said that even though we all wanted to get rid of fossil fuels, it was not something we could possibly do for several decades. We also sighted the underinvestment in the business…and how it had changed the supply side of the supply/demand equation for crude oil. On top of all that, we also focused on how the oil sector was incredibly over-hated when it came to sentiment…and incredibly under-owned when it came to positioning.
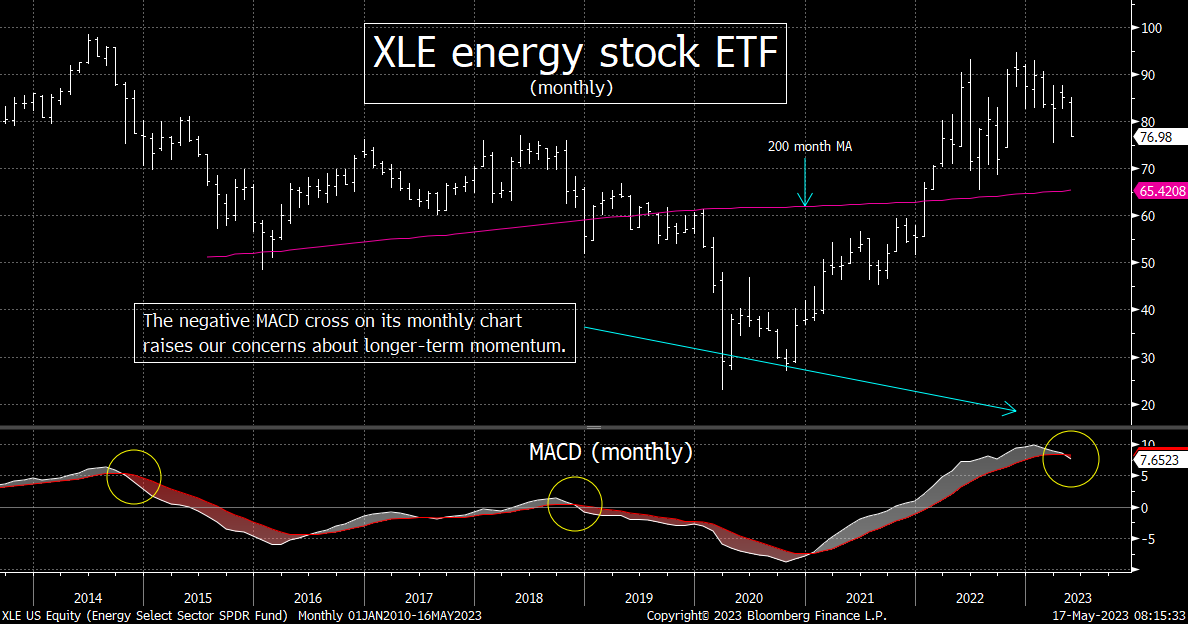
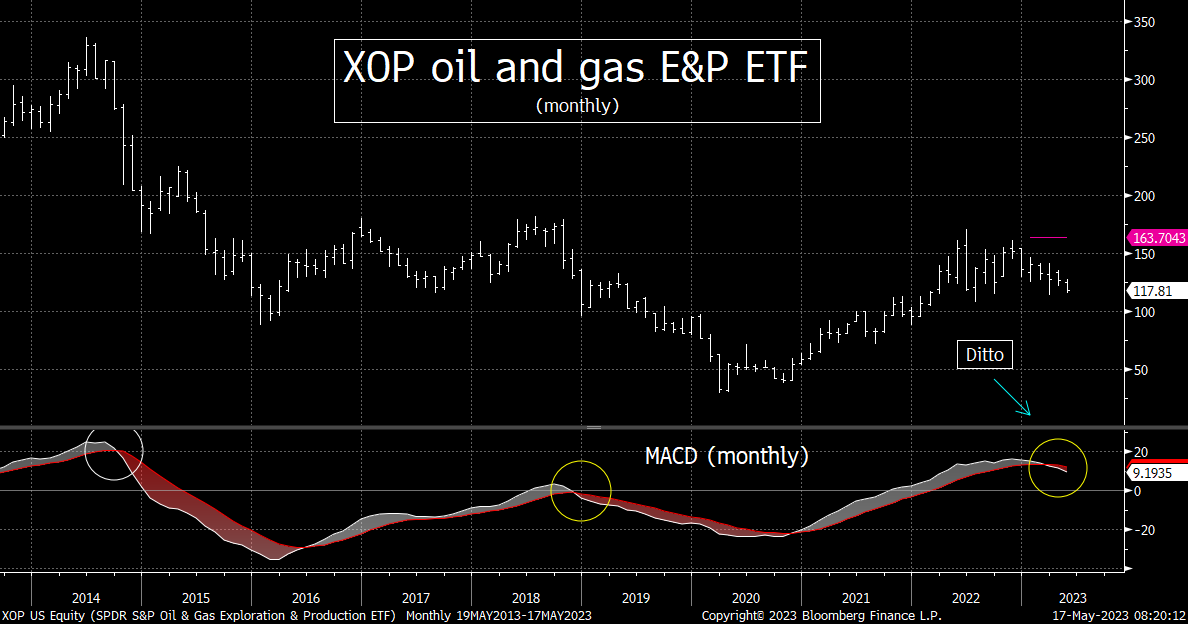
Sure enough, shortly after we turned bullish, the XLE energy stock ETF began a more than 2-year rally that took the ETF higher by 240%...and an even bigger advance in the XOP oil & gas E&P ETF of more than 325%!!! The rest of Wall Street did not turn bullish on the sector until January of 2021 (and some firms took several more months before they turned bullish). These firms were able to capture a very nice part of the bull market in the energy sector, but both the XLE and XOP only advanced half as much as they did after we turned bullish on the group.
On a longer-term basis, we have remained constructive on the energy stocks. Yes, we did turn cautious on a short-term basis…in May of 2021 and June of 2022…but in each of those cases, we predicted the rally would return after several weeks. Those calls also worked out extremely well. The energy stocks did get hit very hard in those cases. For example, in June of last year, the XLE fell 25% and the XOP gave back more than 30%. We returned to out bullish stance by mid-July…and the group saw another serious rally into the fall months.
However, the rally in the XLE that took place in Q4 of last year, did not take-out its June highs in any meaningful way. Instead, it rolled-over…and after one more re-test of the 2022 highs, it has rolled back over again. This time, we’re not thinking that this is a decline that should be “bought on weakness” to the same degree that we did around the Fourth of July holiday last year. Actually, the group is starting to get oversold on a very-near-term basis, so it could/should experience a short-term bounce at some point over the next couple of weeks. However, on a longer-term basis, we’re turning more cautious on the group.
No, this does not mean that we’ve become outright bearish on the energy sector, but it does mean that we think it will have a much tougher time outperforming the broad market to the degree it has on many occasions over the past 2.5 years. Since we turned bullish in October of 2020, the XLE has rallied 170% vs. a rise of about 20% in the S&P 500, but it has not outperformed this year. In fact, it has badly underperformed…and we now think it’s going to have a tougher time playing catch-up…like it did after its pullbacks in 2021 and 2021.
Our concerns are both fundamentally and technically based. On the fundamental side, demand for gasoline and diesel fuel was down in the first quarter here in the U.S. Despite a lower price for both since this time last year, demand was 2% lower for gasoline and 6% lower for diesel (trucks/rail) in Q1. (We’ve also seen a further decline in demand in April.) We readily admit that the summer driving season has not begun, but since much of this lower demand came from before most of the impact of the banking crisis may have had on the consumer, this is a concern on our part.
As you know, we have been saying for several weeks, the credit contraction that is going to take place due to the regional banking crisis (and a few other issues) has raised the odds of a recession in the not-too-distant future. Therefore, the odds are also quite high that any slowdown in YoY demand will become more pronounced in the months ahead…as we go through that summer driving season. If (repeat, IF) this comes to pass, it’s going to create some more weakness in the price of all and the energy stocks……..With domestic demand waning…and Russia still able to sell plenty of oil to China and India…the supply/demand equation for crude is weighing on it from both directions.
On the technical side of things, our biggest concern surrounds the negative crosses we’re seeing in the MONTHLY MACD charts for both the XLE & XOP recently. This is VERY different from what we saw back in June of last year. Remember, negative MACD crosses are a sign of a change in momentum. Since this is taking place on a MONTHLY chart, it raises concerns in our minds that the longer-term momentum has shifted for the sector.
We want to reiterate that this is not a negative call on the energy sector. It’s merely a less bullish one. Even though the supply/demand equation is shifting, the underinvestment in the energy sector for many years now…and the efforts from OPEC…should keep the price of oil well above the $30-$60 range it spent during the half dozen years leading up to 2020. And like we said above, the group is getting close to the kind of oversold level that should lead to a bounce on a short-term basis soon.
Therefore, we are NOT saying that investors should dump their energy names. MANY of them still pay a very nice dividend yield (especially if you picked them up when we turned bullish on them in Q4 of 2020!). These stocks will “pay you to wait” if/when we move into a recessionary period, so they should remain solid holding for most investors….ALSO, there should be period when the group sees some nice bullish “trading opportunities from time to time…..However, we just think it’s going to be tougher for them to outperform again…given the new fundamental and technical backdrop we’re now seeing for these names.
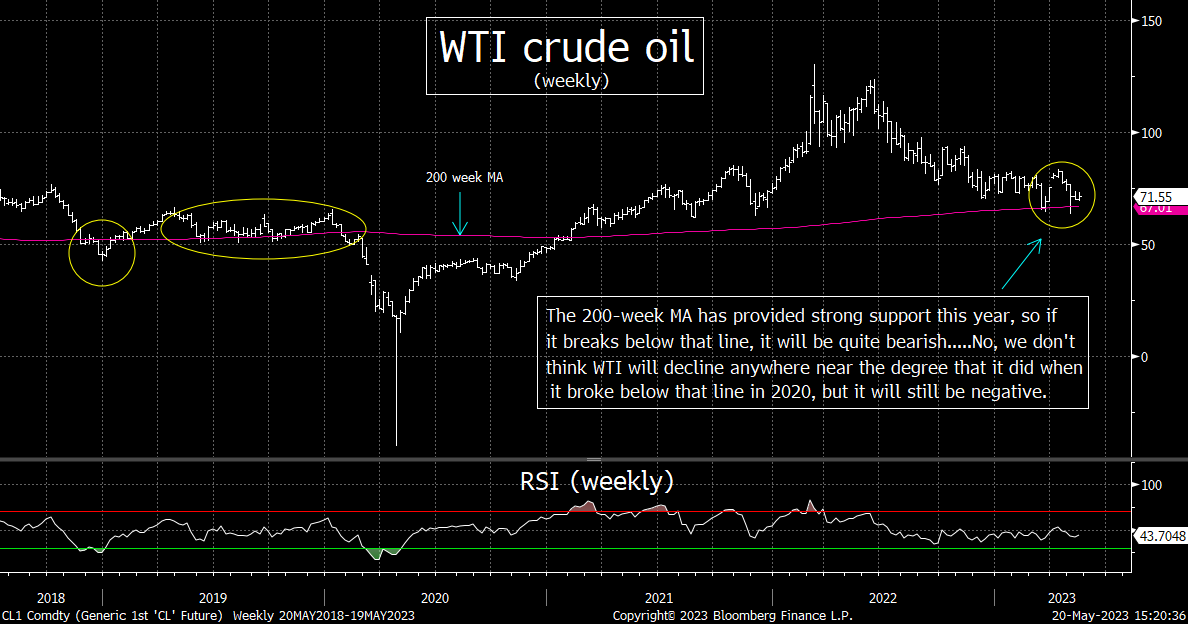
Finally, we’ll just add that we could obviously change our thinking at any time. If the situation changes, we’ll change our opinion. Therefore, we become more bullish again at some point in the future. However, it could also become outright negative. One item we’ll be watching is the 200-week moving average on the price of WTI crude oil. (That’s the 200-WEEK MA, not the 200-day MA.) WTI has broken slightly below that line three different times since March. Each time, however, it was able to regain that line VERY quickly. Thus if (repeat, IF) crude oil drops more meaningfully below that line, it’s going to raise a big red warning flag on crude. Right now, that line comes-in at the $67 level, so we’ll be watching the weekly chart on crude oil if it sees any weakness during the summer months.
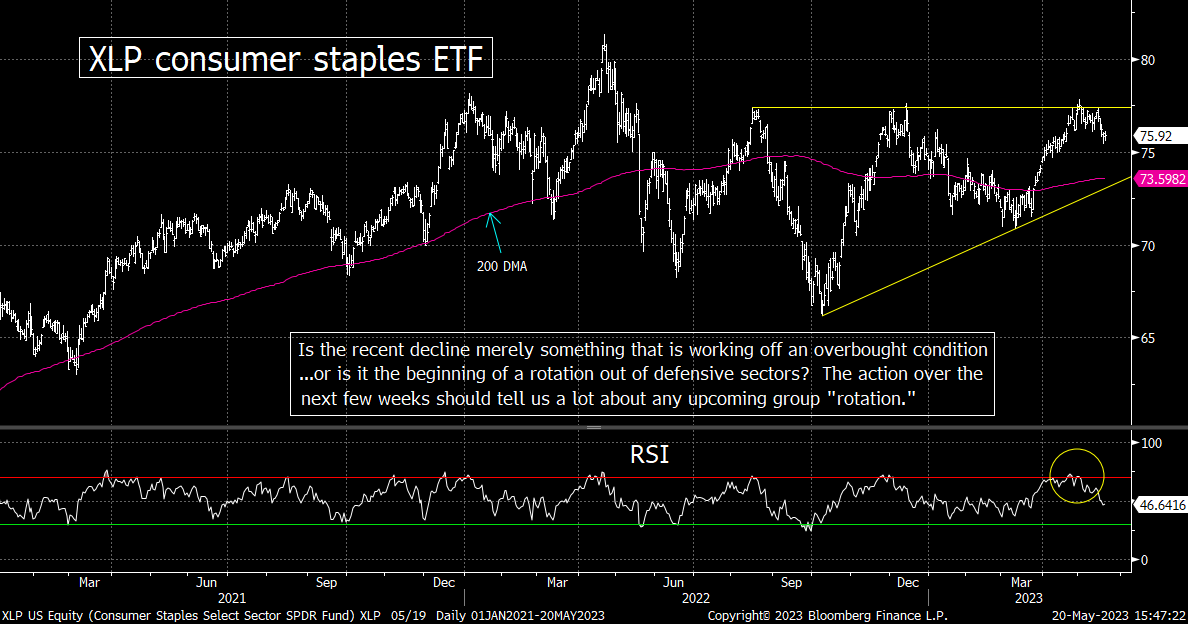
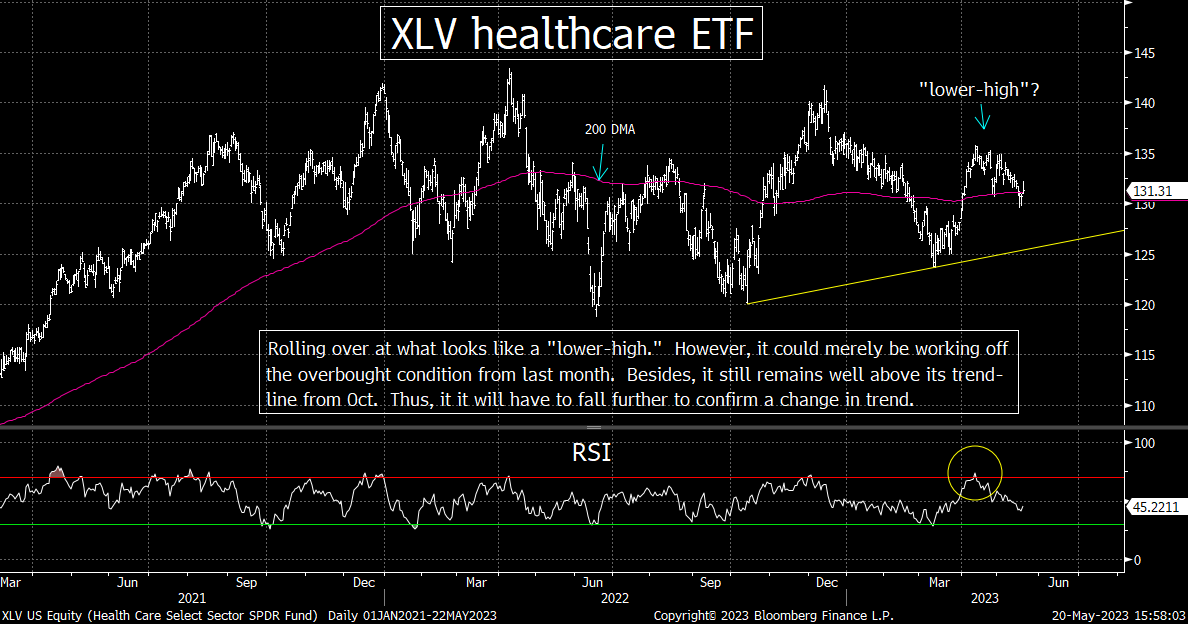
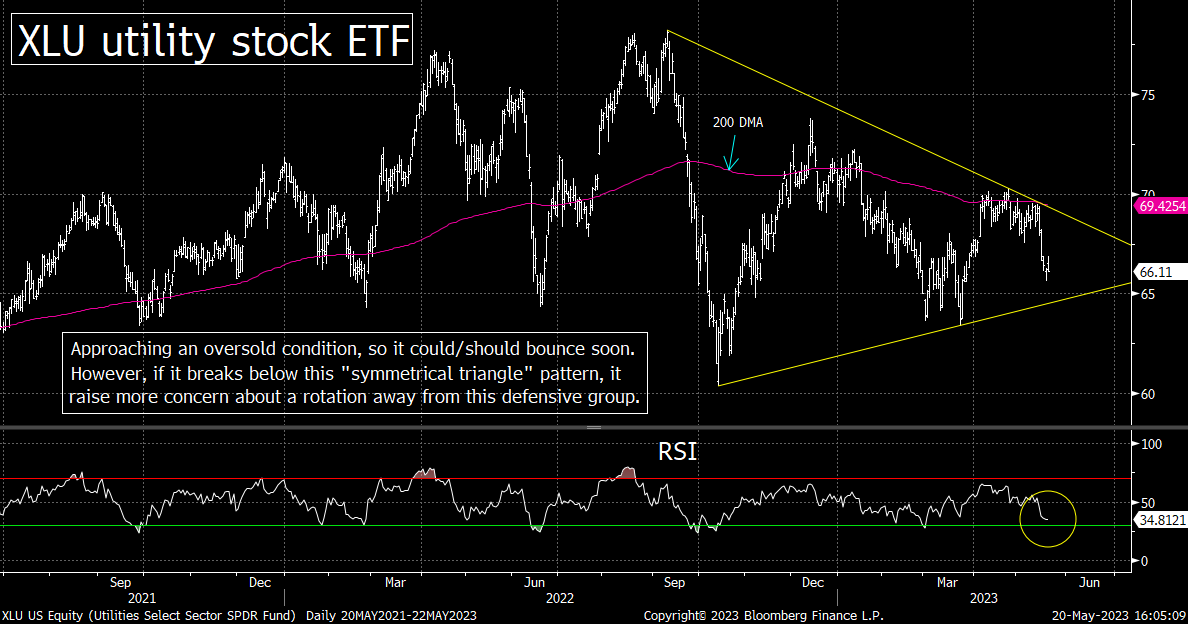
7) We also talked about how several defensive groups have changed from outperforming the market to underperforming recently during the week last week. We want to go into a little more detail on this in our weekend piece. Not only do the consumer staple stocks look vulnerable on the charts, but so do the healthcare and the utility ETF’s. We’re not yet convinced that this is the beginning of a important “rotation” move, but it’s something that will become more probable if we see more weakness in these names in the weeks ahead.
In our daily piece last Friday, we point out that several defensive groups have been underperforming recently. (We highlighted the consumer staples stocks, but we want to include the charts on the XLV healthcare ETF and the XLU utility stock ETF this weekend as well.)…….From the beginning of the regional banking crisis until the end of April, investors bought the big-cap tech names, BUT until late-April, they hedged themselves by ALSO buying several defensive groups like the consumer staples. You can see this from the nice rally in the XLK technology ETF…AND a further advance in the the XLP consumer staples ETF from the March lows until the end of April. The XLK rallied 11% over that timeframe and the XLP was able to keep pace with a 9% advance.
HOWEVER, as the XLK has rallied another 4.4% since the beginning of May, the XLP has rolled-over and declined just over 2%. This divergence just might be telling us that investors feel much less skeptical about this rally…and so they’re starting to unwind some of their defensive positions…and put that money into more aggressive stocks. In other words, instead of putting new money into both tech and defensive groups like consumer staples, they’re now putting most of their new money into tech…AND they also seem to be taking the money they raise from sales of these defensive names…and are moving money into the tech sector. Thus, it looks like the early stages of a “rotation” move away from these defensive names. (We’ll still need to see more downside follow-through in these groups to confirm a change in trend, but the potential is certainly out there.)
The consumer staple group is not the only defensive sector that has been doing poorly recently. The utility and healthcare sectors have also been struggling. After nice rallies off the March lows, the XLU utility ETF and the XLV healthcare ETF have both been declining since late April (with 5% and 3% declines respectively).
Having said all this, the three defensive groups we just highlighted had all become very overbought towards the end of April. Therefore, these pullbacks could merely be normal and healthy ones that are merely working off those overbought conditions…before they resume their outperformance. All three of them remain above their multi-month trend-lines, so we are a long way from raising serious red flags on any of these sectors. However, it is something we’ll be keeping an eye on as we move through the merry month of May.
(To be more specific when it comes to the chart on the XLP, it has formed an “ascending triangle” pattern. It failed to break out of that pattern at the end of April, so we’ll be watching to see if this is just a pullback to work-off its overbought condition…or it become a more substantial move.)
If (repeat, IF), the S&P 500 and NDX 100 can break above the key resistance levels we highlighted yesterday in a significant manner, there’s a good chance that the recent underperformance of these defensive sectors will continue as we move into the summer month. This could be particularly true if (repeat, IF) the Fed keeps providing liquidity to the system…….Therefore, all investors should be watching how this situation plays-out over the next couple of weeks…when strategizing about how they want to play the “sector rotation” game this summer.
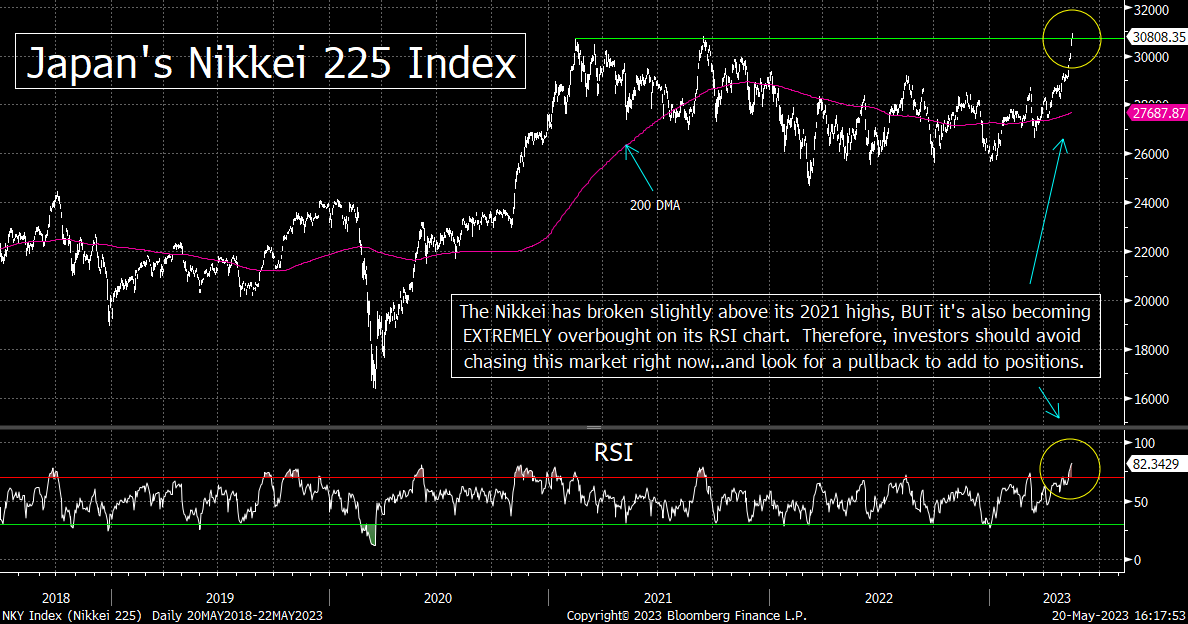
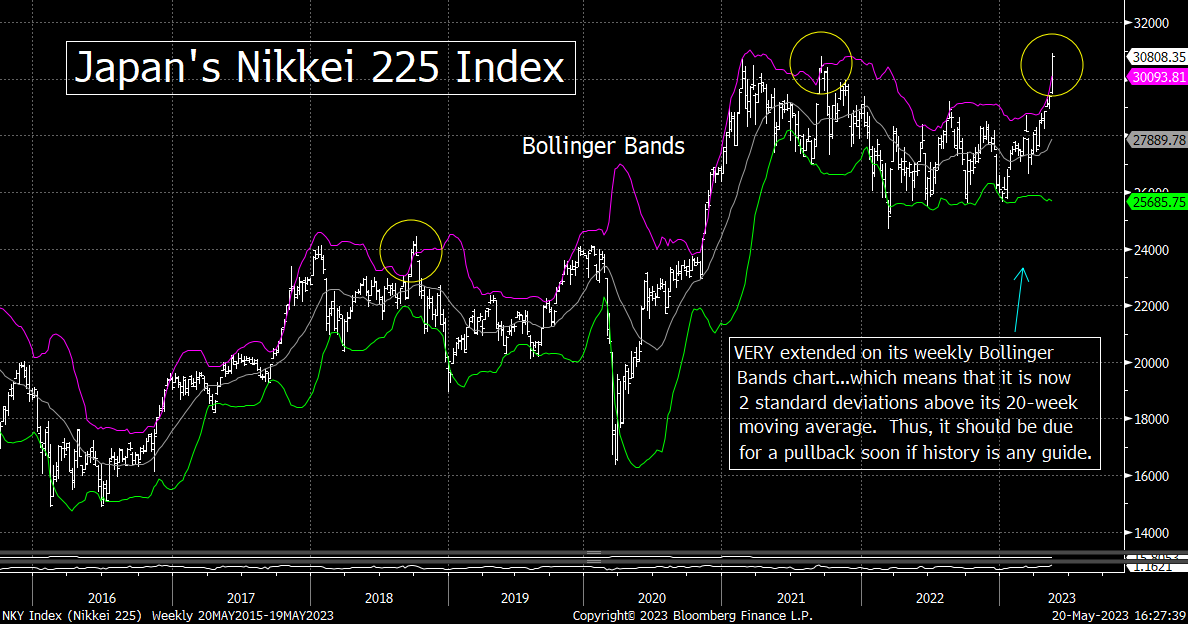
8) Japan’s stock market has had a great year so far this year. The Nikkei Index is up 18% YTD…and we’ve heard some new bullish calls on their market from the Street in the past week. Japan’s stock market could indeed rally a lot further over the last 7.5 months of the year, but we do need to warn investors that it is getting extremely overbought on a near-term basis.
Japan’s stock market has been roaring this year…and this has taken the Nikkei index up to levels it has not seen in over 30 years! Its rally has been a particularly strong one over the past six trading days…as it has rallied by 5.8% over that timeframe. This move now has the Nikkei standing 18% above where it started the year!
Firms like Societe Generale have sighted strong domestic demand in their economy…along with increased company buybacks as reasons to think it can rally further. Goldman Sachs has also made bullish comments…sighting structural changes and reforms…that could fuel further gains in Japan’s stock market. Finally, Warre Buffett commented recently that Berkshire Hathaway has raised his holdings in several of Japan’s financial firms recently…and that he could increase those positions in the future.
We sure there is some sort of statistic that says whenever the Nikkei rallies umpteen percent before the end of May, their stock market rallies an average of X% further by the end of the year. We think those kind of statistics are just trivia, but that does not mean that Japan’s stock market cannot continue to rally quite nicely as the year progresses. (We cannot remember the last time Warren Buffett said bullish things about Japan.)
HOWEVER, we do want to point out that the Nikkei index is getting extremely overbought on a short-term basis. It’s RSI chart has moved above 82…which is its most overbought reading in over five years! We’d also note that the Nikkei has become extremely extended on both its daily and weekly Bollinger Bands charts. In fact, you have to go back to 2013 to find a time with its weekly BB chart was as extended as it is today. Back then, it was followed by a decline of more than 20% in just over one month.
No, we are not saying that Japan’s stock market is about to roll-over and fall 20%. Heck, it could rally a bit more over the very-short-term. Nonetheless, on a technical basis, there is no question that the most recent part of this rally has been SO strong that it has taken it to a very overbought condition. Therefore, investors should be careful about chasing this rally up at these levels. They could/should be able to add to positions are lower levels at some point in the coming weeks.
9) We just wanted to take one bullet point to make a quick observation about artificial intelligence. This particular observation has very little to do with the markets. The aspect we’ll touch-on when it comes to AI might not even have a big impact on the economy. However, it’ IS going to have a big impact on the lives of tens of thousands of people around the world in the coming years.
We want to talk about one aspect of artificial intelligence that few people are talking about right now. We’re not trying to imply that we’re going to say about AI is going to we wildly profound…or that it will change your thinking about this technology. It’s just something that we think people should consider when they’re thinking about this subject.
Anyway, we’ve been hearing for 40 years that some technology or another is going to make employees more productive. In many cases, those other technological advances have indeed made many people more productive…and there is little question that this has been a key narrative surrounding AI in recent weeks/months.
However, when the experts say that AI will make people more productive…what they’re really saying is that it will make a very small number of people more productive…and it will make a very large number of people unnecessary.
There’s not a whole lot we can add to our introduction to this bullet point. AI is going to make a lot of jobs unnecessary and/or irrelevant. Yes, the people who remain in their positions will very likely be much more productive at their jobs, but that really only means that they’ll be paid the same amount of money to do what took many more people to do in the past. In other words, a lot of people are going to lose their jobs due to this new technology.
This does not mean it will be a bad thing. It could/should be very positive for the economy and the markets over the longer-term. Also, if the markets do revert back to trading on the fundamentals…instead of excess liquidity, the decline in the markets (and in the AI related stocks), it’s going to present a fabulous opportunity for investors…in the way Stanley Druckenmiller described just over a week ago.
We also need to remember that technology has been making jobs obsolete since the beginning of human society…and most people tend to find a way to adapt. We’re just saying that a lot of jobs are going to become obsolete going forward…and thus a lot of people are going to go through some gut-wrenching times in the years ahead…as AI becomes a bigger force in our society.
10) Summary of our current stance………As we moved through mid-week last week, we started to hear and read a decent amount of bearishness recede from the marketplace. We’re seeing a similar move in the sentiment polls…where bearishness is nowhere near the extremes were saw at the beginning of the year. We don’t mean to portray this situation as one where this shift in sentiment has completely reversed…and is now one that has reached extremely bullish proportions. That is not the case at all. However, the sentiment readings we’re seeing…and the comments we hear and read from many pundits…are much more constructive than they were a few short weeks ago.
Of course, this is not a huge surprise given that the S&P 500 and NDX 100 have rallied 9% And 26% respectively YTD. Those kinds of rallies make it very tough to stay bearish. However, when trying to discern if this rally will continue, we have to ask ourselves, “What has changed?” Well, since the beginning of March, several things have indeed changed. We’ve had a regional banking crisis…which means that credit going to contract in the weeks and months ahead. We’ve seen a significant decline in the shares of publicly traded private equity firms decline substantially…as the IPO market has dried up, takeovers/buyouts have become much tougher, and money has become less plentiful for new investments.
On top of this, we’ve seen many economic statistics indicating that we’ll have weaker growth as we move into the summer months and beyond. We’ve also seen key economically sensitive commodities like copper fall significantly (and break below key support levels) over the past two months…and we’re seeing some signs that the consumer is starting to become strained as well. (Even Nike dropped below its sideways range for the year last week!)….Finally, many individual stocks that are very economically sensitive (like UPS, CAT, ODFL, etc.) have had a very tough time in recent weeks. (BTW, did you see the 7% downward reversal in DE on Friday?)…….When you throw-in the fact that there is an outside chance that the U.S. will default on their credit, you can see that the situation has deteriorated as the stock market has rallied over the past two months or so.
Of course, the not all the news has been bad. Earnings were lower in Q1, but not by as much as people had thought they’d be…and full year estimates have actually increased by very small amount. Also, even though we’re seeing a few cracks in the jobs picture, they are very small ones so far…and the overall employment picture remains robust. However, looking at the broad picture…and knowing that credit is going to contract quite a bit going forward…it’s hard to say that the advance in the market since the March lows has been fundamentally based. It’s also hard to argue that a further advance will be fundamentally supported…given that the market was already expensive, and the economic picture has deteriorated over the past two months as well.
The point we’re trying to make this weekend is that the present economic backdrop does not justify the stock market to be trading at 19.2x forward earnings and 2.3x sales. Since we’re looking at a credit crunch, the economic outlook does not justify these kinds of valuations either. Therefore, if the stock market is going to hold at current levels…and especially if it’s going to advance further…the “Fed put” that has reappeared when the regional banking crisis developed is going to have to be maintained.
Maintaining the renewed “Fed put” does not involve a “pause” in interest rates. In fact, it’s going to be hard to maintain a “Fed put” even if they start to cut rates. (When the market is still expensive, rate cuts don’t help anywhere near as much as they do when the market is cheap. Just look at what happened when the Fed started cutting rates in 2001…when the S&P was still trading at about 19x reported earnings!!!) In other words, it’s going to have to involve continued liquidity injections.
Therefore, it is our belief that the stock market’s fate is back in the hands of the Fed once again. If they have renewed the “Fed put” indefinitely…like they did in when the pivoted in late-2018/early-2019…the stock market should hold up just fine. (The problem is that it will likely inflate another bubble.)…..However, we also have to consider that they might let the problems with the regional banks run its course. If the situation is not systemic anymore, they just might start removing that excess liquidity once again. In other words, if they don’t chicken out like they did 4-5 years ago…and they continue to wring-out the excesses of the past 15 years…the bear market is going to return in a big way.
Matthew J. Maley
Founder, The Maley Report
TheMaleyReport.com
matthewjmaley@gmail.com
Although the information contained in this report (not including disclosures contained herein) has been obtained from sources we believe to be reliable, the accuracy and completeness of such information and the opinions expressed herein cannot be guaranteed. This report is for informational purposes only and under no circumstances is it to be construed as an offer to sell, or a solicitation to buy, any security. Any recommendation contained in this report may not be appropriate for all investors. Trading options is not suitable for all investors and may involve risk of loss. Additional information is available upon request.